Sentinel-2 is a multispectral operational imaging mission within the GMES (Global Monitoring for Environment and Security) program, jointly implemented by the EC (European Commission) and ESA (European Space Agency) for global land observation (data on vegetation, soil and water cover for land, inland waterways and coastal areas, and also provide atmospheric absorption and distortion data corrections) at high resolution with high revisit capability to provide enhanced continuity of data so far provided by SPOT-5 and Landsat-7. 1) 2) 3) 4) 5) 6) 7) 8)
|
Copernicus is the new name of the European Commission's Earth Observation Programme, previously known as GMES (Global Monitoring for Environment and Security). The new name was announced on December 11, 2012, by EC (European Commission) Vice-President Antonio Tajani during the Competitiveness Council. In the words of Antonio Tajani: “By changing the name from GMES to Copernicus, we are paying homage to a great European scientist and observer: Nicolaus Copernicus (1473-1543). As he was the catalyst in the 16th century to better understand our world, so the European Earth Observation Programme gives us a thorough understanding of our changing planet, enabling concrete actions to improve the quality of life of the citizens. Copernicus has now reached maturity as a programme and all its services will enter soon into the operational phase. Thanks to greater data availability user take-up will increase, thus contributing to that growth that we so dearly need today.” |
Table 1: Copernicus is the new name of the former GMES program 9)
The overall GMES user requirements of the EU member states call for optical observation services in the areas of Global Climate Change (Kyoto Protocol and ensuing regulations), sustainable development, European environmental policies (e.g. spatial planning for Soil Thematic Strategy, Natura 2000 and Ramsar Convention, Water Framework Directive), European civil protection, common agricultural policy, development and humanitarian aid, and EU Common Foreign & Security Policy.
To meet the user needs, the Sentinel-2 satellite data will support the operational generation of the following high level products like:
• Generic land cover, land use and change detection maps (e.g. CORINE land cover maps update, soil sealing maps, forest area maps)
• Maps of geophysical variables (e.g. leaf area index, leaf chlorophyll content, leaf water content).
The mission is dedicated to the full and systematic coverage of land surface (including major islands) globally with the objective to provide cloud-free products typically every 15 to 30 days over Europe and Africa. To achieve this objective and to provide high mission availability, a constellation of two operational satellites is required, allowing to reach a 5-day geometric revisit time. The revisit time with only one operational satellite as it will be the case at the beginning of the deployment of the system is 10 days. - In comparison, Landsat-7 provides a 16-day geometric revisit time, while SPOT provides a 26-day revisit, and neither of them provides systematic coverage of the overall land surface.
The following list summarizes the top-level system design specifications derived from the user requirements:
• Sentinel-2 will provide continuity of data for services initiated within the GSE (GMES Service Element) projects. It will establish a key European source of data for the GMES Land Fast Track Monitoring Services and will also contribute to the GMES Risk Fast Track Services.
• The frequent revisit and high mission availability goals call for 2 satellites in orbit at a time, each with a 290 km wide swath using a single imaging instrument
• Continuous land + islands carpet mapping imaging within the latitude range of -56º to +83º (the selected orbit excludes imagery from Antarctica)
• 10 m, 20 m, and 60 m spatial resolution (in the VNIR to SWIR spectral range) to identify spatial details consistent with 1 ha MMU (Minimum Mapping Unit)
• An accurate geolocation (< 20 m) of the data is required (without GCPs) and shall be produced automatically to meet the timeliness requirements. The geolocation accuracy of Level 1 b imagery data w.r.t. WGS-84 (World Geodetic System - 1984) reference Earth ellipsoid of better than 20 m at 2σ confidence level without need of any ground control points is required.
• Very good radiometric image quality (combination of onboard absolute and on ground vicarious calibration).
• The mission lifetime is specified as 7.25 years and propellant is to be sized for 12 years, including provision for de-orbiting maneuvers at end-of-life.
• 2 weeks of satellite autonomy and maximum decoupling between flight operations and mission exploitation
|
Fast Track Service (Land Monitoring Core Services) |
Compliance of the Sentinel-2 system |
|
Geographic coverage |
All land areas/islands covered (except Antarctica) |
|
Geometrical revisit |
5 days revisit cloud free fully in line with vegetation changes |
|
Spectral sampling |
Unique set of measurement/calibration bands |
|
Service continuity |
Sentinel-2A launch in 2014: the mission complements the SPOT and Landsat missions. |
|
Spatial resolution |
< 1 ha MMU (Minimum Mapping Unit) fully achievable with 10 m |
|
Acquisition strategy |
Systematic push-broom acquisitions, plus lateral mode capability for emergency events monitoring |
|
Fast Track Service (Emergency Response Core Service) |
Compliance of the Sentinel-2 system |
|
Spatial resolution down to 5 m |
Reference/damage assessment maps limited to the 10m SSD (Spatial Sampling Distance) |
|
Accessibility/timeliness down to 6 hrs offline & 24hrs in NRT |
Fully compliant (retrieval of already archived reference data in < 6 hrs, and delivery of data after request in NRT in 3 hrs for L1c) |
Table 2: Sentinel-2 fast track service compliance to land user requirements
To provide operational services over a long period (at least 15 years following the launch of the first satellites), it is foreseen to develop a series of four satellites, with nominally two satellites in operation in orbit and a third one stored on ground as back-up.
In partnership: The Sentinel-2 mission has been made possible thanks to the close collaboration between ESA, the European Commission, industry, service providers and data users. Demonstrating Europe’s technological excellence, its development has involved around 60 companies, led by Airbus Defence and Space in Germany for the satellites and Airbus Defence and Space in France for the multispectral instruments. 10)
The mission has been supported in kind by the French space agency CNES to provide expertise in image processing and calibration, and by the German Aerospace Center DLR that provides the optical communication payload, developed by Tesat Spacecom GmbH.
This piece of technology allows the Sentinel-2 satellites to transmit data via laser to satellites in geostationary orbit carrying the European Data Relay System (EDRS). This new space data highway allows large volumes of data to be relayed very quickly so that information can be even more readily available for users.
Seven years in the making, this novel mission has been built to operate for more than 20 years. Ensuring that it will meet users’ exacting requirements has been a challenging task. Developing Sentinel-2 has involved a number of technical challenges, from early specification in 2007 to qualification and acceptance in 2015.
The satellite requires excellent pointing accuracy and stability and, therefore, high-end orbit and attitude control sensors and actuators. The multispectral imager is the most advanced of its kind, integrating two large visible near-infrared and shortwave infrared focal planes, each equipped with 12 detectors and integrating 450,000 pixels.
Pixels that may fail in the course of the mission can be replaced by redundant pixels. Two kinds of detectors integrate high-quality filters to isolate the spectral bands perfectly. The instrument’s optomechanical stability must be extremely high, which has meant the use of silicon carbide ceramic for its three mirrors and focal plane, and for the telescope structure itself.
The geometric performance requires strong uniformity across the focal planes to avoid image distortion. The radiometric performance excluded any compromise regarding stray light, dictating a tight geometry and arrangement of all the optical and mechanical elements. The instrument is equipped with a calibration and shutter mechanism that integrates a large spectralon sunlight diffuser.
Each satellite has a high level of autonomy, so that they can operate without any intervention from the ground for periods of up to 15 days. This requires sophisticated autonomous failure analysis, detection and correction on board.
The ‘carpet mapping’ imaging plan requires acquisition, storage and transmission of 1.6 TB per orbit. This massive data blast results from the combination of the 290 km swath with 13 spectral channels at a spatial resolution as high as 10 m.
In addition, the optical communication payload using the EDRS data link is a new technology that will improve the amount and speed of data delivery to the users. This was very recently demonstrated by Sentinel-1A, which also carries an optical communication payload.
Land in focus: Ensuring that land is used sustainably, while meeting the food and wood demands of a growing global population – a projected eight billion by 2020 – is one of today’s biggest challenges. The Copernicus land service provides information to help respond to global issues such as this as well as focusing on local matters, or ‘hotspots’, that are prone to specific challenges.
However, this service relies on very fast revisit times, timely and accurate satellite data in order to make meaningful information available to users – hence, the role of Sentinel-2. Through the service, users will have access to information about the health of our vegetation so that informed decisions can be made – whether about addressing climate change or how much water and fertilizer are needed for a maximum harvest.
Sentinel-2 is able to distinguish between different crop types and will deliver timely data on numerous plant indices, such as leaf area index, leaf chlorophyll content and leaf water content – all of which are essential to accurately monitor plant growth. This kind of information is essential for precision farming: helping farmers decide how best to nurture their crops and predict their yield.
While this has obvious economic benefits, this kind of information is also important for developing countries where food security is an issue. The mission’s fast geometric revisit of just five days, when both satellites are operational, and only 10 days with Sentinel-2A alone, along with the mission’s range of spectral bands means that changes in plant health and growth status can be easily monitored.
Sentinel-2 will also provide information about changes in land cover so that areas that have been damaged or destroyed by fire, for example, or affected by deforestation, can be monitored. Urban growth also can be tracked.
The Copernicus services are managed by the European Commission. The five ‘pan-European’ themes covering 39 countries are addressed by the land service, including sealed soil (imperviousness), tree cover density, forest type, and grasslands. There is currently insufficient cloud-free satellite data in high resolution with all the necessary spectral bands that cover Europe fast enough to monitor vegetation when it is growing rapidly in the summer. Sentinel-2 will fill this gap.
This multi-talented mission will also provide information on pollution in lakes and coastal waters at high spatial resolution and with frequent coverage. Frequent coverage is also key to monitoring floods, volcanic eruptions and landslides. This means that Sentinel-2 can contribute to disaster mapping and support humanitarian aid work.
Leading edge: The span of 13 spectral bands, from the visible and the near-infrared to the shortwave infrared at different spatial resolutions ranging from 10 to 60 m on the ground, takes global land monitoring to an unprecedented level.
The four bands at 10 m resolution ensure continuity with missions such as SPOT-5 or Landsat-8 and address user requirements, in particular, for basic land-cover classification. The six bands at 20 m resolution satisfy requirements for enhanced land-cover classification and for the retrieval of geophysical parameters. Bands at 60 m are dedicated mainly to atmospheric corrections and cirrus-cloud screening.
In addition, Sentinel-2 is the first civil optical Earth observation mission of its kind to include three bands in the ‘red edge’, which provide key information on the vegetation state.
Thanks to its high temporal and spatial resolution and to its three red edge bands, Sentinel-2 will be able to see very early changes in plant health. This is particularly useful for the end users and policy makers to detect early signs of food shortages in developing countries (Ref. 10).
|
Sentinel-2A launch |
June 23, 2015, by Vega from Kourou, French Guiana |
|
Sentinel-2B launch |
March 2017, by Vega from Kourou, French Guiana |
|
Orbit |
Sun-synchronous at altitude 786 km, Mean Local Solar Time at descending node: 10:30 (optimum Sun illumination for image acquisition) |
|
Geometric revisit time |
Five days from two-satellite constellation (at equator) |
|
Design life |
Seven years (carries consumable for 12 years: 123 kg of fuel including end of life deorbiting) |
|
MSI (Multispectral Imager) |
MSI covering 13 spectral bands (443–2190 nm), with a swath width of 290 km and a spatial resolution of 10 m (four visible and near-infrared bands), 20 m (six red edge and shortwave infrared bands) and 60 m (three atmospheric correction bands). |
|
Receiving stations |
MSI data: transmitted via X-band to core Sentinel ground stations and via laser link through EDRS. |
|
Main applications |
Agriculture, forests, land-use change, land-cover change. Mapping biophysical variables such as leaf chlorophyll content, leaf water content, leaf area index; monitoring coastal and inland waters; risk and disaster mapping |
|
Mission |
Managed, developed, operated and exploited by various ESA establishments |
|
Funding |
ESA Member States and the European Union |
|
Prime contractors |
Airbus Defence & Space Germany for the satellite, Airbus Defence & Space France for the instrument |
|
Cooperation |
CNES: Image quality optimization during in-orbit commissioning |
Table 3: Facts and figures
Space segment:
In April 2008, ESA awarded the prime contract to Airbus Defence and Space (former EADS-Astrium GmbH) of Friedrichshafen, Germany to provide the first Sentinel-2A Earth observation satellite. In the Sentinel-2 mission program, Astrium is responsible for the satellite’s system design and platform, as well as for satellite integration and testing. Astrium Toulouse will supply the MSI (MultiSpectral Instrument), and Astrium Spain is in charge of the satellite’s structure pre-integrated with its thermal equipment and harness. The industrial core team also comprises Jena Optronik (Germany), Boostec (France), Sener and GMV (Spain). 11) 12) 13) 14)
In March 2010, ESA and EADS-Astrium GmbH signed another contract to build the second Sentinel-2 (Sentinel-2B) satellite, marking another significant step in the GMES program. 15) 16) 17)
Sentinel-2 uses the AstroBus-L of EADS Astrium, a standard modular ECSS (European Cooperation for Space Standards) compatible satellite platform compatible with an in-orbit lifetime of up to 10 years, with consumables sizeable according to the mission needs. The platform design is one-failure tolerant and the standard equipment selection is based on minimum Class 2 EEE parts, with compatibility to Class 1 in most cases. The AstroBus-L platform is designed for direct injection into LEO (Low Earth Orbit). Depending on the selection of standard design options, AstroBus-L can operate in a variety of LEOs at different heights and with different inclinations. An essential feature of AstroBus-L is the robust standard FDIR (Failure Detection, Isolation and Recovery) concept, which is hierarchically structured and can easily be adapted to specific mission needs.

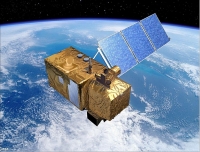
Figure 1: Artist's rendition of the Sentinel-2 spacecraft (image credit: ESA, Airbus DS)
The satellite is controlled in 3-axes via high-rate multi-head star trackers, mounted on the camera structure for better pointing accuracy and stability, and gyroscopes and a GNSS receiver assembly. The AOCS (Attitude and Orbit Control Subsystem) comprises the following elements: 18)
• A dual frequency GPS receiver (L1/L2 code) for position and time information
• A STR (Star Tracker) assembly for precise attitude information (use of 3 STRs)
• A RMU (Rate Measurement Unit) for rate damping and yaw acquisition purposes
• A redundant precision IMU (Inertial Measurement Unit) for high-accuracy attitude determination
• Magnetometers (MAG) for Earth magnetic field information
• CESS (Coarse Earth Sun Sensors) for coarse Earth and Sun direction determination
• 4 RW (Reaction Wheels) and 3 MTQ (Magnetic Torquers)
• RCS (Reaction Control System) a monopropellant propulsion system for orbit maintenance with 1 N thrusters
The different tasks of the AOCS are defined the following modes:
• Initial Acquisition and Save Mode (rate damping, Earth acquisition, yaw acquisition, steady-state)
• Normal Mode (nominal and extended observation)
• Orbit Control Mode (in- and out-of-plane ΔV maneuvers).

Figure 2: Overview of the AOCS architecture (image credit: EADS Astrium)
The geolocation accuracy requirements of < 20 m for the imagery translate into the following AOCS performance requirements as stated in Table 4.
|
Attitude determination error (onboard knowledge) |
≤ 10 µrad (2σ) per axis |
|
AOCS control error |
≤ 1200 µrad (3σ) per axis |
|
Relative pointing error |
≤ 0.03 µrad/1.5 ms (3σ); and ≤ 0.06 µrad/3.0 ms (3σ) |
Table 4: AOCS performance requirements in normal mode
For Sentinel-2 it was decided to mount both the IMU and the star trackers on the thermally controlled sensor plate on the MSI. So the impact of time-variant IMU/STR misalignment on the attitude performance can be decreased to an absolute minimum. Furthermore, the consideration of the time-correlated star tracker noises by covariance tuning was decided.

Figure 3: Sentinel-2 spacecraft architecture (image credit: Astrium GmbH)

Figure 4: Block diagram of the Sentinel-2 spacecraft (image credit: EADS Astrium)
The EPS (Electric Power Subsystem) consists of:
• Solar Array (one deployable and rotatable single wing with three panels). Total array area of 7.1 m2. Use of 2016 triple junction GaAs solar cells with integrated diode. Total power of 2300 W (BOL) and 1730 W (EOL). The mass is < 40 kg.
• SADM (Solar Array Drive Mechanism) for array articulation. Use of a two phase stepper motor with µ-stepping to minimize parasitic distortions during MSI operation, motor step angle 1.5º. Mass of < 3.2 kg.
• PCDU (Power Control and Distribution Unit). PCDU with one unregulated 28 V ±4 V main power bus. Mass of < 21.6 kg; the in-orbit life is 12.25 years.
• Li-ion batteries with 8 cells in series. Total capacity of 102 Ah @ EOL. Mass = 51 kg.

Figure 5: Block diagram of the electrical power subsystem (image credit: EADS Astrium)
The OBC is based on the ERC32 PM (Processor Module) architecture. The PLDHS (Payload Data Handling System) provides source data compression from 1.3 Gbit/s to 450 Mbit/s [state-of-the-art lossy compression (wavelet transform)].
The spacecraft mass is ~ 1200 kg, including 275 kg for the MSI instrument, 35 kg for the IR payload (optional) and 80 kg propellant (hydrazine). The S/C power is 1250 W max, including 170 W for the MSI and < 100 W for the IR payload. The spacecraft is designed for a design life of 7.25 years with propellant for 12 years of operations, including deorbiting at EOL (End of Life).
|
Spacecraft mass, power |
~1200 kg, 1700 W |
|
Hydrazine propulsion system |
120 kg hydrazine (including provision for safe mode, debris avoidance and EOL orbit decrease for faster re-entry) |
|
Spacecraft design life |
7 years with propellant for 12 years of operations |
|
AOCS (Attitude and Orbit Control Subsystem) |
- 3-axis stabilized based on multi-head Star Tracker and fiber optic gyro - Accurate geo-location (20 m without Ground Control Points) |
|
RF communications |
X-band payload data downlink at 560 Mbit/s |
|
Onboard data storage |
2.4 Tbit, and data formatting unit (NAND-flash technology as baseline) that supplies the mission data frames to the communication subsystems. |
|
Optical communications |
LCT (Laser Communication Terminal) link is provided via EDRS (European Data Relay Satellite) |
Table 5: Overview of some spacecraft parameters

Figure 6: Schematic view of the deployed Sentinel-2 spacecraft (image credit: EADS Astrium)

Figure 7: The Sentinel-2 spacecraft in launch configuration (image credit: ESA)
Payload data are being stored in NAND flash memory technology SSR (Solid State Recorder) based on integrated CoReCi (Compression Recording and Ciphering) units of Airbus DS, available at various capacities. The CoReCi is an integrated image compressor, mass memory and data ciphering unit designed to process, store and format multi-spectral video instrument data for the satellite downlink. The mass memory utilizes high performance commercial Flash components, ESA qualified and up-screened for their use in space equipment. This new Flash technology allows mass and surface area used in the memory to be reduced by a factor of nearly 20 when compared with the former SD-RAM (Synchronous Dynamic Random Access Memory) based equipment. The first CoReCi unit has been successfully operating on SPOT-6 since September 2012. Sentinel-2A is carrying a CoReCi unit. 19) 20)
The MRCPB (Multi-Résolution par Codage de Plans Binaires) compression algorithm used is a wavelet transform with bit plane coding (similiar to JPEG 2000). This complex algorithm is implemented in a dedicated ASIC, with speeds of up to 25 Mpixel/s. Alternatively this unit can be supplied with a CCSDS compression algorithm using a new ASIC developed with ESA support. The ciphering is based on the AES algorithm with 128 bit keys. The modularity of the design allows the memory capacity and data rate to be adapted by adjusting the number of compressor and memory boards used.
Development status:
• February 27, 2017: The ninth Vega light-lift launcher is now complete at the Spaceport, with its Sentinel-2B Earth observation satellite installed atop the four-stage vehicle in preparation for a March 6 mission from French Guiana. 21)
• January 12, 2017: Sentinel-2B arrived at Europe’s spaceport in Kourou, French Guiana on 6 January 2017 to be prepared for launch. After being moved to the cleanroom and left for a couple of days to acclimatise, cranes were used to open the container and unveil the satellite. Over the next seven weeks the satellite will be tested and prepared for liftoff on a Vega rocket. 22)
• November 15, 2016: Sentinel-2B has successfully finished its test program at ESA/ESTEC in Noordwijk, The Netherlands. The second Sentinel-2 Airbus built satellite will now be readied for shipment to the Kourou spaceport in French Guiana begin January 2017. It is scheduled for an early March 2017 lift-off on Vega. 23)
- Offering "color vision" for the Copernicus program, Sentinel-2B like its twin satellite Sentinel-2A will deliver optical images from the visible to short-wave infrared range of the electromagnetic spectrum. From an altitude of 786 km, the 1.1 ton satellite will deliver images in 13 spectral bands with a resolution of 10, 20 or 60 m and a uniquely large swath width of 290 km.
• June 15, 2016: Airbus DS completed the manufacture of the Sentinel-2B optical satellite; the spacecraft is ready for environmental testing at ESA/ESTEC. The Sentinel-2 mission, designed and built by a consortium of around 60 companies led by Airbus Defence and Space, is based on a constellation of two identical satellites flying in the same orbit, 180° apart for optimal coverage and data delivery. Together they image all Earth’s land surfaces, large islands, inland and coastal waters every five days at the equator. Sentinel-2A was launched on 23 June 2015, its twin, Sentinel-2B, will follow early next year. 24)
- The Sentinel-1 and -2 satellites are equipped with the Tesat-Spacecom’s LCT (Laser Communication Terminal). The SpaceDataHighway is being implemented within a Public-Private Partnership between ESA and Airbus Defence and Space.

Figure 8: Sentinel-2B being loaded at Airbus Defence and Space’s satellite integration center in Friedrichshafen, Germany (image credit: Airbus DS, A. Ruttloff)
• April 27, 2015: The Sentinel-2A satellite on Arianespace’s next Vega mission is being readied for pre-launch checkout at the Spaceport, which will enable this European Earth observation platform to be orbited in June from French Guiana. — During activity in the Spaceport’s S5 payload processing facility, Sentinel-2A was removed from the shipping container that protected this 1,140 kg class spacecraft during its airlift from Europe to the South American launch site. With Sentinel-2A now connected to its ground support equipment and successfully switched on, the satellite will undergo verifications and final preparations for a scheduled June 11 liftoff. 25)

Figure 9: Sentinel-2A is positioned in the Spaceport’s S5 payload processing facility for preparation ahead of its scheduled June launch on Vega (image credit: Arianespace)
• April 23, 2015: The Sentinel-2A satellite has arrived safe and sound in French Guiana for launch in June. The huge Antonov cargo aircraft that carried the Sentinel-2A from Germany, touched down at Cayenne airport in the early morning of 21 April. 26)
• April 8, 2015: The Sentinel-2A satellite is now being carefully packed away in a special container that will keep it safe during its journey to the launch site in French Guiana. The satellite will have one final test, a ‘leak test’, in the container to ensure the propulsion system is tight. Bound for Europe’s Spaceport in French Guiana, Sentinel-2A will leave Munich aboard an Antonov cargo plane on 20 April. Once unloaded and unpacked, it will spend the following weeks being prepared for liftoff on a Vega rocket. 27)
• February 24, 2015: Sentinel-2A is fully integrated at IABG’s facilities in Ottobrunn, Germany before being packed up and shipped to French Guiana for a scheduled launch in June 2015. 28)

Figure 10: Photo of the Sentinel-2A spacecraft in the thermal vacuum chamber testing at IAGB's facilities (image credit: ESA, IABG, 2015)
• In August 2014, Airbus Defence and Space delivered the Sentinel-2A environmental monitoring satellite for testing . In the coming months, the Sentinel-2A satellite will undergo a series of environmental tests at IABG, Ottobrunn, Germany, to determine its suitability for use in space. 29) 30)

Figure 11: Sentinel-2A solar array deployment test at IABG (Airbus Defence & Space), image credit: ESA 31)
- Sentinel-2A is scheduled to launch in June 2015; Sentinel-2B, which is identical in design, is set to follow in March 2017. Together, these two satellites will be able to capture images of our planet’s entire land surface in just five days in a systematic manner.

Figure 12: Photo of the Sentinel-2A spacecraft at the satellite integration center in Friedrichshafen, Germany (image credit: Airbus DS, A. Ruttloff)
Launch: The Sentinel-2A spacecraft was launched on June 23, 2015 (1:51:58 UTC) on a Vega vehicle from Kourou. 32) 33)
RF communications: The payload data handling is based on a 2.4 Tbit solid state mass memory and the payload data downlink is performed at a data rate of 560 Mbit/s in X-band with 8 PSK modulation and an isoflux antenna, compliant with the spectrum bandwidth allocated by the ITU (international Telecommunication Union).
Command and control of the spacecraft (TT&C) is performed with omnidirectional S-band antenna coverage using a helix and a patch antenna. The TT&C S-band link provides 64 kbit/s in uplink (with authenticated/encrypted commands) and 2 Mbit/s in downlink..
The requirements call for 4 core X-band ground stations for full mission data recovery by the GMES PDS (Payload Data System).
In parallel to the RF communications, an optical LEO-GEO communications link using the LCT (Laser Communication Terminal) of Tesat-Spacecom (Backnang, Germany) will be provided on the Sentinel-2 spacecraft. The LCT is based on a heritage design (TerraSAR-X) with a transmit power of 2.2 W and a telescope of 135 mm aperture to meet the requirement of the larger link distance. The GEO LCT will be accommodated on AlphaSat of ESA/industry (launch 2012) and later on the EDRS (European Data Relay Satellite) system of ESA. The GEO relay consists of an optical 2.8 Gbit/s (1.8 Gbit/s user data) communication link from the LEO to the GEO satellite and of a 600 Mbit/s Ka-band communication link from the GEO satellite to the ground. 34)
To meet the user requirements of fast data delivery, DLR (German Aerospace Center) is funding the OCP (Optical Communication Payload), i.e. the LCT of Tesat, – a new capability to download large volumes of data from the Sentinel-2 and Sentinel-1 Earth observation satellites - via a data relay satellite directly to the ground. A contract to this effect was signed in October 2010 between ESA and DLR. 35)
Since the Ka-band downlink is the bottleneck for the whole GEO relay system, an optical ground station for a 5.625 Gbit/s LEO-to-ground and a 2.8 Gbit/s GEO-to-ground communication link is under development.
Orbit: Sun-synchronous orbit, altitude = 786 km, inclination = 98.5º, (14+3/10 revolutions/day) with 10:30 hours LTDN (Local Time at Descending Node). This local time has been selected as the best compromise between cloud cover minimization and sun illumination.
The orbit is fully consistent with SPOT and very close to the Landsat local time, allowing seamless combination of Sentinel-2 data with historical data from legacy missions to build long-term temporal series. The two Sentinel-2 satellites will be equally spaced (180º phasing) in the same orbital plane for a 5 day revisit cycle at the equator.
The Sentinel-2 satellites will systematically acquire observations over land and coastal areas from -56° to 84° latitude including islands larger 100 km2, EU islands, all other islands less than 20 km from the coastline, the whole Mediterranean Sea, all inland water bodies and closed seas. Over specific calibration sites, for example DOME-C in Antarctica, additional observations will be made. The two satellites will work on opposite sides of the orbit (Figure 13).

Figure 13: Twin observation configuration of the Sentinel-2 spacecraft constellation (image credit: ESA)
Launch: The Sentinel-2B spacecraft was launched on March 7, 2017 (01:49:24UTC) on a Vega vehicle of Arianespace from Europe's Spaceport in Kourou, French Guiana. 36) 37) 38) 39)
• The first stage separated 1 min 55 seconds after liftoff, followed by the second stage and fairing at 3 min 39 seconds and 3 min 56 seconds, respectively, and the third stage at 6 min 32 seconds.
• After two more ignitions, Vega’s upper stage delivered Sentinel-2B into the targeted Sun-synchronous orbit. The satellite separated from the stage 57 min 57 seconds into the flight.
• Telemetry links and attitude control were then established by controllers at ESOC in Darmstadt, Germany, allowing activation of Sentinel’s systems to begin. The satellite’s solar panel has already been deployed.
• After this first ‘launch and early orbit’ phase, which typically lasts three days, controllers will begin checking and calibrating the instruments to commission the satellite. The mission is expected to begin operations in three to four months.
Sentinel-2B will join its sister satellite Sentinel-2A and the other Sentinels part of the Copernicus program, the most ambitious Earth observation program to date. Sentinel-2A and -2B will be supplying ‘color vision’ for Copernicus and together they can cover all land surfaces once every five days thus optimizing global coverage and the data delivery for numerous applications. The data provided by these Sentinel-2 satellites is particularly suited for agricultural purposes, such as managing administration and precision farming.
With two satellites in orbit it will take only five days to produce an image of the entire Earth between the latitudes of 56º south and 84º north, thereby optimizing the global coverage zone and data transmission for numerous applications.
To ensure data continuity two further optical satellites, Sentinel-2C and -2D, are being constructed in the cleanrooms of Airbus and will be ready for launch as of 2020/2021.

Figure 14: Illustration of the Sentinel-2B spacecraft in orbit (image credit: Airbus DS, Ref. 38)
Figure 15: This technical view of the Sentinel-2 satellite shows all the inner components that make up this state-of-the-art high-resolution multispectral mission (video credit: ESA/ATG medialab)
Figure 16: As well as imaging in high resolution and in different wavelengths, the key to assessing change in vegetation is to image the same place frequently. The Sentinel-2 mission is based on a constellation of two satellites orbiting 180° apart, which along with their 290 km-wide swaths, allows Earth’s main land surfaces, large islands, inland and coastal waters to be covered every five days. This is a significant improvement on earlier missions in the probability of gaining a cloud-free look at a particular location, making it easier to monitor changes in plant health and growth (video credit: ESA/ATG medialab)
Note: As of March 2020, the Sentinel-2 file has been split into a total of four files. — As of May 2019, the previously single large Sentinel-2 file has been split into two additional files, to make the file handling manageable for all parties concerned, in particular for the user community.
• This article covers the Sentinel-2 mission and its imagery in the period 2020
• Sentinel-2 imagery in the period 2019
• Sentinel-2 imagery in the period 2018 to 2017
 Copernicus: Sentinel-2 continued
Mission status and some imagery of 2020 + 2021
• April 23, 2021: The Copernicus Sentinel-2 mission takes us over the sediment-stained waters in Laizhou Bay, located on the southern shores of the Bohai Sea, on the east coast of mainland China. 40)
- The bay is the smallest of three main bays of the Bohai Sea, and is named after the city of Laizhou, visible to the east (Figure 17). Large quantities of sediment carried by the Yellow River, visible in the left of the image, discolor the waters of the bay and appear turquoise. This sediment can be seen throughout the waters in this image, even far from the coast.
- The Yellow River is China’s second longest river, with a length of over 5400 km, and is surpassed only by the Yangtze River. The river rises in the Bayan Har Mountains in Western China and flows through nine provinces before emptying into the Laizhou Bay. Its drainage basin is the third largest in the country, with an area of around 750,000 km2.
- The river is estimated to carry 1.6 billion tons of silt annually, carrying the majority to the sea. Owing to this heavy load of silt, the Yellow River deposits soil in stretches, ultimately elevating the river bed. Excessive sediment deposits have raised the river bed several meters above the surrounding ground, sometimes causing damaging floods.
- On the southern coast of Laizhou Bay, in the bottom of the image, flooded fields are visible and are most likely artificial fish farms. The city of Dongying, home to the second largest oilfield in China, is visible in the left of the image.
- Copernicus Sentinel-2 is a two-satellite mission. Each satellite carries a high-resolution camera that images Earth’s surface in 13 spectral bands. The mission is mostly used to track changes in the way land is being used and to monitor the health of vegetation.

Figure 17: This Sentinel-2 image, acquired on 26 February 2020, is also featured on the Earth from Space video program. This image was processed in a way that included the near-infrared channel, which makes vegetation appear bright red. The lush vegetation can be distinguished from the brown fields in the image, which are unharvested or not yet fully grown (image credit: ESA, the image contains modified Copernicus Sentinel data (2020), processed by ESA, CC BY-SA 3.0 IGO)
• April 16, 2020: Volcanic eruptions on Saint Vincent have blanketed the Caribbean island in ash leading to over 16 000 residents to be evacuated from their homes. False-color images captured by the Copernicus Sentinel-2 mission show the aftermath of the explosive eruption that took place on 9 April 2021. 41)
- La Soufrière is an active stratovolcano on the Caribbean island of Saint Vincent in Saint Vincent and the Grenadines. A series of explosive events began in April 2021, forming a plume of volcanic ash reaching 8 km in height, and generating pyroclastic flows down the volcano’s south and southwest flanks.
- The images have been processed in a way that included the satellite’s near-infrared channel. This type of band combination is most commonly used to assess plant density and health, as plants reflect near-infrared and green light, while absorbing red. Since they reflect more near-infrared than green, dense, plant-covered land appears in bright red.
- In response to the eruption, the Copernicus Emergency Mapping Service was activated. The service uses satellite observations to help civil protection authorities and, in cases of disaster, the international humanitarian community, respond to emergencies.

Figure 18: This image was captured on 8 April, one day before the first main eruption (image credit: ESA, the image contains modified Copernicus Sentinel data (2021), processed by ESA, CC BY-SA 3.0 IGO)

Figure 19: This image was taken on 13 April, and shows the northern part of the island covered in ash ((image credit: ESA, the image contains modified Copernicus Sentinel data (2021), processed by ESA, CC BY-SA 3.0 IGO)
• April 16, 2021: On 22 April 2021, on Earth Day, Thomas Pesquet is planned to return to the International Space Station for his second mission, Alpha. Ahead of his launch, the Copernicus Sentinel-2 mission takes us over Cape Canaveral, USA, in a region known as the Space Coast. 42)
- The cape area is part of the region known as the Space Coast, and is home to the Kennedy Space Center – including the space shuttle landing facility, a visitor’s center, Cape Canaveral Air Force Station and a space vehicle assembly building. Launch Complex 39A, visible along the coast (Figure 20), is where the Saturn V rocket carrying Apollo 11 began its voyage to the moon in 1969, carrying Neil Armstrong, Michael Collins, and Edwin ‘Buzz’ Aldrin.
- Before the space program was launched, Cape Canaveral was a stretch of barren, sandy scrubland. The cape was chosen for rocket launches owing to its close proximity to the equator. As the linear velocity of Earth’s surface is greatest towards the equator, the southerly location of the cape allows for rockets to take advantage of this by launching eastward – in the same direction as Earth’s rotation.
- The space center is included in the Merritt Island National Wildlife Refuge, visible in the top of the image, which occupies more than 550 km2 of estuaries and marshes. It preserves the habitat of around 1000 plant and 500 wildlife species, included several endangered species. The city of Cape Canaveral lies just south of the space center and around 8 km north of Cocoa Beach (visible in the bottom of the image).
- It is from here where French ESA astronaut Thomas Pesquet will be launched on his second mission to the International Space Station. Thomas will be the first ESA astronaut to fly on a SpaceX Crew Dragon launching on a Falcon 9 rocket, together with NASA astronauts Shane Kimbrough and Megan McArthur and JAXA astronaut Akihiko Hoshide. He will be the first European to launch from the US since 2011, when Roberto Vittori, from Italy, flew onboard space shuttle Endeavour to deliver the Alpha Magnetic Spectrometer.
- During his six-month mission, called Alpha, Thomas will spend much of his time on scientific research and will also be carrying out maintenance tasks as part of the station’s crew. Towards the end of his mission, he will serve as commander of the Station. He will be the fourth European to hold the post of commander, after ESA astronauts Frank De Winne, Alexander Gerst and Luca Parmitano.

Figure 20: Cape Canaveral is a cape and city in Brevard County, in east-central Florida. The cape is separated from the mainland by the Banana River, Merritt Island and the Indian River from east to west. This image, captured on 2 February 2021, is also featured on the Earth from Space video program (image credit: ESA)
• April 9, 2021: The Copernicus Sentinel-2 mission takes us over Bucharest – the capital and largest city of Romania. 43)

Figure 21: Bucharest lies on the southeast corner of the Romanian Plain, on the banks of the Dâmbovita River, a small tributary of the Danube. The city covers an area of around 225 km2, in an area once covered by the Vlăsiei forest, which, after it was cleared, gave way to a fertile flatland. This image is also featured on the Earth from Space video program (image credit: ESA, the image contains modified Copernicus Sentinel data (2020), processed by ESA, CC BY-SA 3.0 IGO)
- The city is characterized by a number of main squares from which streets and boulevards radiate. One of the main boulevards, Bulevardul Unirii, can be spotted in the middle of the city and leads the way to the Palace of Parliament.
- An icon of the country’s capital, this monumental building is the largest in Europe and the world’s second-largest administrative building after the Pentagon in the United States. It is home to the Parliament of Romania as well as the National Museum of Contemporary Art.
- Several lakes stretch across the northern part of the city, the most important of which are Lake Herăstrău, Lake Floreasca, Lake Tei, and Lake Colentina. In the centre of the capital is a small artificial lake – Lake Cişmigiu – surrounded by the Cişmigiu Gardens.
- Văcăresti Nature Park can be seen in the southern part of the city. Covering an area of around 190 hectares, the park contains the wetlands surrounding Lake Văcăresti and hosts close to 100 species of birds, half of which are protected.
- Agricultural fields dominate the rest of this week’s image. Romania is one of the biggest agricultural producers in the European Union, exporting mainly maize, wheat and other grains.
• April 8, 2021: Italy’s Mount Etna, Europe’s most active volcano, has recently been on explosive form, with 17 eruptions in less than three months. Instruments onboard three different satellites orbiting Earth have acquired imagery of the eruptions – revealing the intensity of the lava-fountaining eruptive episodes, known as paroxysms. 44)

Figure 22: This Copernicus Sentinel-2 animation shows the latest activity taking place in Mount Etna from 16 February 2021 until 2 April 2021 (image credit: ESA, the image contains modified Copernicus Sentinel data (2021), processed by ESA, CC BY-SA 3.0 IGO)
- Located on the east coast of Sicily, Mount Etna is one of the world’s most active volcanoes. Its eruptions occur at the summit, where there are four craters: the Voragine and the Bocca Nuova, formed in 1945 and 1928 respectively, the Northeast Crater, the highest point on Etna (3330 m) and the Southeast Crater, which has recently been the most active of the four.
- Starting in February 2021, the Southeast Crater produced a series of intense lava fountains coloring the night sky in hues of orange and red. Over the course of the following weeks, the volcano produced lava fountains reaching as high as 1.5 km.
- These spectacular explosions are amongst the highest observed at the Southeast Crater in recent decades. In the past, lava fountains reaching the same height were only observed at the Voragine crater in December 2015 – with lava fountains of over 2000 m.
- Different satellites carry different instruments that can provide a wealth of complementary information to understand volcanic eruptions. Once an eruption begins, optical instruments can capture the various phenomena associated with it, including lava flows, mudslides, ground fissures and earthquakes.
- Atmospheric sensors on satellites can also identify the gases and aerosols released by the eruption, as well as quantify their wider environmental impact. The image below, captured by the Copernicus Sentinel-5P satellite, shows the sulphur dioxide concentrations visible travelling southwards towards Libya. Sulphur dioxide is released from a volcano when magma is relatively close to the surface.

Figure 23: Sulphur dioxide concentrations on 24 March 2021. Atmospheric sensors on satellites can also identify the gases and aerosols released by the eruption, as well as quantify their wider environmental impact. This image, captured by the Copernicus Sentinel-5P satellite, shows the sulphur dioxide concentrations visible travelling southwards towards Libya. Sulphur dioxide is released from a volcano when magma is relatively close to the surface (image credit: ESA, the image contains modified Copernicus Sentinel data (2021), processed by ESA, CC BY-SA 3.0 IGO)
- After a week or so of remaining calm, Etna’s Southeast Crater re-awoke on the morning of 31 March with a loud explosion at around 07:00 CEST, followed by several puffs of ash and lava.
- According to the National Institute of Geophysics and Volcanology in Italy (INGV), the explosive activity increased in the late afternoon and during the night with lava flowing towards the Valle del Bove, with smaller flows advancing southwards. As of today, activity in the Southeast Crater remains calm.
• March 29, 2021: Climate change is having an undeniable influence on coastal areas. A substantial proportion of the world’s sandy coastlines are already eroding owing to increased storm surges, flooding and sea level rise. With our coastal environments in constant change, Earth observation satellites are being used to better strengthen our knowledge of changing coastlines. 45)
- For decades, coastal areas have been subject to intense urbanization and population growth. The European Union coastline is approximately 68,000 km long, more than three times longer than that of the United States. According to the European Environment Agency, almost half of the EU population lives less than 50 km from the sea, with the seaside being Europe’s most popular holiday destination.
- Coastal erosion is currently observed on many shorelines in Europe and will most likely worsen with rising sea levels. Monitoring coastal movement is key in understanding the evolution of coastal environments and these data can prove fundamental information to regional decision-makers.
- ESA has been developing an array of products to address these challenges. As part of ESA’s EO Science for Society program, the Coastal Change from Space project is providing important insights into global coastal changes. Using 25 years of satellite imagery, including data from the Copernicus Sentinel-1 and Sentinel-2 missions, the team has mapped 2800 km of coastline analyzed across four nations: The United Kingdom, Ireland, Spain and Canada.

Figure 24: This image shows the annual mean shoreline change in Start Bay, Devon. Areas in red indicate strong erosion, while areas in dark blue show strong accretion (image credit: ESA, the image contains modified Copernicus sentinel data (2018-19), processed by ESA/ARGANS Ltd.)
- As part of this project, a special process has been developed and applied to ensure each pixel from every image has a greatly improved accuracy on the ground, as well as identifying where the coastline is precisely located on a specific date.
- The frequent revisit rate of the Sentinel-1 and Sentinel-2 missions has enabled the changes to be observed as well as more permanent and extreme movements due to storm events. These results were then validated by a team of independent scientists from the four nations using results from field observations and local knowledge.
- Roberto Díaz Sánchez, from the Directorate General for the Coast and the Sea at the Ministry for the Ecological Transition and the Demographic Challenge, commented, “Taking part in this project has enlightened us in coastal surveillance from space. We are now firmly on the road to a new and promising coastal management paradigm, increasing our chances in successfully adapting our coasts to the effects of climate change.”
- The current dataset of over 30,000 individual images is now being used to help coastal scientists better understand their local processes.

Figure 25: This image shows the shoreline changes along the coast of Malgrat de Mar, Spain. Areas of erosion between 1994 and 2019 are visible in red, while areas of accretion between 1994 and 2019 are visible in blue. The 1994 coastline data is extracted from US Landsat data while the 2019 data is from the Copernicus Sentinel-2 mission (image credit: ESA, the image contains modified Copernicus sentinel data (2018-19), processed by ESA/ARGANS Ltd/Landsat)
- Mónica López, Spanish Delegate at ESA and Centre for the Development of Industrial Technology, said, “I would like to congratulate all of the team for the successful project which is focused in a very important topic for some countries, including Spain. I would like to remark a very positive aspect of the project which has been the high involvement of final users in all the phases of the project, mainly during validation and testing.”
- Koen Verbruggen, Director Geological Survey Ireland at the Department of Environment, Climate & Communications, added, “The datasets being produced under the ESA-funded Coastal Change from Space project have great potential application in Ireland and come at a very opportune time as we are establishing a National Coastal Change Management Strategy. The coastal change data can help us recognize areas of greatest change, and thus prioritize the allocation of resources at national and local levels.”
- The next stage in the journey will be to use this insightful datasets to improve the performance of models and join with other infrastructure and coastal zone morphological knowledge to improve forecasts and enable sensible mitigation strategies to be employed.
- On 22 January, the results of the Coastal Change from Space project were presented in an online webinar.
• March 26, 2021: The Gariep Dam, the largest dam in South Africa, is featured in this false-color image captured by the Copernicus Sentinel-2 mission. 46)
- The image of Figure 26 has been processed in a way that highlights vegetation in shades of green and water bodies in black. The water on the east side of the Gariep Dam appears in royal blue owing to a large quantity of sediments coming from the Orange River, therefore appearing brighter than the water flowing out of the west side of the dam.
- The Orange River plays an important role in the South African economy by providing water for irrigation and hydroelectric power. It rises in the Drakensberg mountains in Lesotho, flowing westwards through South Africa to the Atlantic Ocean.
- The river is said to be one of the world’s most turbid, and is estimated to deliver around 60 million tons of sediment each year to the western margin of South Africa. A significant quantity of this sediment is believed to be from soil erosion, an increasing environmental threat to sustainability in southern Africa.
- The bright green circular shapes along the Orange River are an example of center-pivot irrigation systems, where equipment rotates around a centre pivot and crops are fed with water from the centre of the arc.
- The rest of the image is dominated by bare soil and rocky terrain which appear in different shades of pink and red. Straight lines in the image are roads which connect this area to other parts of South Africa.

Figure 26: The Gariep Dam, visible in the bottom right of the image, lies along the Orange River, bordering the Free State and Eastern Cape provinces. The dam’s primary purpose is for irrigation, domestic and industrial use as well as power generation. The wall of the Gariep Dam, which is around 88 m high and 900 m long, holds back the Gariep Reservoir and, when full, the reservoir covers an area of around 360 km2. Sentinel-2 captured this image 30 January 2020, it is also featured on the Earth from Space video program (image credit: ESA)
• March 22, 2021: Clustered at the edge of the Crocodile River in Mpumalanga Province, South Africa, stand thousands of farms and small holdings growing fresh fruit and sugar cane. Water to irrigate the crops is taken from the river, but this slows its flow rate and leaves less for those downstream. 47)
- On World Water Day, how can the government achieve the sustainable use of water for the benefit of all South Africans? ESA has been working in partnership with two Dutch companies and a South African catchment management authority to find a solution.
- Some 20 year ago, in response to severe water shortages, the South African government passed the National Water Act, which is intended to restrict the amount of water farmers use for irrigation.
- However ensuring that farmers only take the water to which they are entitled is tricky.
- Maurits Voogt, who works for HydroLogic, a relatively small company based in Amersfoort in the Netherlands, says: “It is a major task to monitor and enforce the legal use of water in places where there are limited qualified personnel available, and the areas that need to be monitored are huge.
- “We have developed a smart, satellite-based water auditing service as part of ESA’s program ARTES ( Advanced Research in Telecommunications Systems). It allows water management authorities to monitor irrigated water use in large areas without actually needing to visit every single farm.
- “By doing so, the water auditing application helps them implement regulatory measures effectively, and thereby supports the sustainable use of water resource.”

Figure 27: Farms along Crocodile River. Captured by the Copernicus Sentinel-2 mission, this image shows farms next to the Crocodile River in Mpumalanga Province, South Africa. Farmers growing sugar cane and fresh fruit take water from the river to irrigate their crops, leaving less for those people living downstream. In response to severe water shortages, the South African government passed the National Water Act of 1998, which is intended to restrict the amount of water farmers use for irrigation (image credit: ESA, the image contains modified Copernicus Sentinel data (2018), processed by ESA, CC BY-SA 3.0 IGO)
- The water auditing service uses evapotranspiration data calculated from satellite imagery by partner company eLEAF, based in Wageningen.
- Combined with rainfall data from rain gauges and satellites, this evapotranspiration data is used to calculate how much water is used for irrigation. The application automatically compares the water use with data taken from a national water use register that lists the amount of water allocated to each farm.

Figure 28: Circular cultivated areas along Crocodile River. Captured by the Copernicus Sentinel-2 mission, this image shows circular cultivated areas in farms next to the Crocodile River in Mpumalanga Province, South Africa. Farmers growing sugar cane and fresh fruit take water from the river to irrigate their crops, leaving less for those people living downstream. In response to severe water shortages, the South African government passed the National Water Act of 1998, which is intended to restrict the amount of water farmers use for irrigation (image credit: ESA, the image contains modified Copernicus Sentinel data (2018), processed by ESA, CC BY-SA 3.0 IGO)
- In a pilot project, staff from HydroLogic and eLEAF used the technology to study irrigated water use for more than 50,000 fields covering some 40,000 km2 — about the area of the Netherlands.
- The team analyzed a handful of farms to confirm that the system could identify which farms had used large volumes of water compared to their neighbors.
- The costs of the pilot project were shared between ESA, eLEAF, Hydrologic and the Inkomati-Usuthu Catchment Management Authority, which is responsible for managing water resources in the region through which the Crocodile River flows.
- Following the demonstration project, the Inkomati-Usuthu Catchment Management Authority signed ongoing contracts for the water auditing service.
- Tendai Sawunyama, manager of resource planning and operations for the Inkomati-Usuthu Catchment Management Authority, says: “The application allows water managers to prioritize where to investigate for over-usage or illegal abstraction of water, and to make better decisions on where to place water meters. It can improve the understanding of water use and water allocation, and therefore help to create more sustainable water use in agriculture.”
- The water auditing application has been rolled out across South Africa to all catchment management authorities. It is now being modified to cater for the different user requirements needed by regional water authorities in Colombia and the Netherlands.
- It was developed with the support of ESA Space Solutions through the ESA Business Applications program.
• March 19, 2012: Ahead of the International Day of Forests, the Copernicus Sentinel-2 mission takes us over part of the Amazon rainforest in the Amazonas – the largest state in Brazil. 48)
- As its name implies, the Amazonas is almost entirely covered by the Amazon rainforest – the world’s largest tropical rainforest covering an area of around six million sq km. The Amazon is the world’s richest and most-varied biological reservoir, containing several million species of insects, birds, plants and other forms of life.

Figure 29: This image has been processed using the infrared channel of the Sentinel-2 satellite which makes the dense rainforest appear in bright green. This makes differences in vegetation coverage more evident than only using the visible channels of the satellite that our eyes are able to see. In this image, the Juruá River, the most-winding river in the Amazon basin, is visible. The river appears in shades of maroon and magenta as the reflected sunlight from the water’s surface consists of a mix of mainly blue and green, while the reflection in the near infrared is almost zero – leading to the colors we see here. This image is also featured on the Earth from Space video program (image credit: ESA, the image contains modified Copernicus Sentinel data (2019), processed by ESA, CC BY-SA 3.0 IGO)
- The Juruá river, which flows more than 3000 km before emptying into the Amazon River, is turbid with relatively high nutrient levels. The river rises in the highlands in east-central Peru before winding its way through lowlands in Brazil.
- Several crescent-shaped oxbow lakes can be seen flanking the river. Oxbow lakes are generally formed when rivers cut through a meander ‘neck’ to shorten its course, causing the old channel to be blocked off – migrating away from the lake and creating a more direct route.
- The Tarauacá River, a tributary of Juruá, can be seen in the left of the image. Eirunepé, a settlement established in the 19th Century as a hub for rubber production, is visible in the top-left of the image.
- The 21 March marks the International Day of Forests – a day which seeks to raise awareness on a range of benefits that sustainably managed forests can contribute to our lives. According to the United Nations, the world is losing 10 million hectares of forest each year, which accounts for 12-20% of the global greenhouse gas emissions that contribute to climate change.
- The Amazon rainforest is crucial for helping to regulate global warming as the forests absorb millions of tons of carbon emissions every year. As plants grow, they remove carbon dioxide from the atmosphere and store it as biomass. This is then released back to the atmosphere through processes such as deforestation for agriculture and wildfires.
- Tracking biomass changes is key to understanding the global carbon cycle and also for informing global climate models that help predict future change. Earth observation satellites have been instrumental in helping our understanding of this important process. New maps produced by ESA’s Climate Change Initiative, provide a global view of above ground biomass are pertinent in helping to support forest management, emissions reduction and sustainable development policy goals.
- ESA’s upcoming Biomass mission will provide crucial information about the state of our forests and how they are changing. The satellite will pierce through woodland canopies to perform a global survey of Earth’s forests over the course of Biomass’s mission.
• March 12, 2021: The Strait of Gibraltar connects the Mediterranean Sea with the Atlantic Ocean and separates southernmost Spain from northernmost Africa. The channel is 58 km long and narrows to 13 km in width between Point Marroquí (Spain) and Point Cires (Morocco). Ferries and vessels can be seen travelling across the strait and crossing between the two continents. 49)
- Water bodies, such as the Mediterranean Sea and the Atlantic Ocean, appear in dark blue or black while turbid waters, such as those visible along the Spanish coast in the top-left of the image, appear in cyan or light blue. This is most likely due to sediment-laden waters flowing from rivers into the sea. Inland water bodies, such as the Barbate Reservoir visible at the top of the image, can be spotted in various shades of azure owing to their turbidity.
- Several prominent cities can be seen in the image in grey. These include Tangier, the port and principal city of northern Morocco which lies just 27 km from the southern tip of Spain. Tétouan lies along the Martil Valley and can be seen in the bottom-right of the image. Its medina is a designated UNESCO World Heritage site since 1997.
- At the southern end of the Iberian Peninsula, the Bay of Gibraltar can be seen. The shoreline is densely populated and the shore is divided, from west to east, between the Spanish municipalities of Algeciras, Los Barrios, San Roque, La Línea de la Concepción and the British Overseas Territory of Gibraltar.

Figure 30: This false-color image, captured on 28 October 2020, was processed in a way that included the near-infrared channel. This type of band combination from Copernicus Sentinel-2 is most commonly used to assess plant density and health, as plants reflect near-infrared and green light, while absorbing red. Since they reflect more near-infrared than green, dense, plant-covered land appears in bright red. This image is also featured in the Earth from Space program (image credit: ESA)
• March 5, 2021: The Copernicus Sentinel-2 mission takes us over the Galápagos Islands – a volcanic archipelago situated some 1000 km west of Ecuador in the Pacific Ocean. 50)
- The archipelago consists of 13 major islands and a handful of smaller islands and islets scattered across approximately 60,000 km2 of ocean. Repeated volcanic eruptions and ongoing seismic activity have helped form the rugged mountain landscape of the islands. In this image, captured on 23 September 2020, several circular volcanic cones can be seen atop the islands.
- The largest island of the archipelago, Isabela (Albemarle), is visible in the center. Around 132 km in length, the island’s seahorse shape is the result of the merging of multiple large volcanoes into a single land mass. The five volcanoes seen on the island are (from north to south): Wolf Volcano, Darwin Volcano, Alcedo Volcano, Sierra Negra Volcano and Cerro Azul Volcano. Two of the island’s volcanoes, Ecuador and Wolf, lie directly on the Equator.
- At the southern end of the island, hills covered with forests can be seen in bright green, separating the Sierra Negra, the most active of the Galapagos volcanoes, from the sandy coastline (partially visible here owing to cloud cover). Tortuga Island, named for its distinct shape, can be seen southeast from Isabela. The tiny island is actually a collapsed volcano that is a nesting location for a variety of seabirds.
- The second largest island of the archipelago, Santa Cruz, can be seen to the right of Isabela. Its capital, Puerto Ayora (not visible), is the most populated urban center in the islands.
- The Galápagos Islands are best known for their diverse array of plant and animal species, many of which are endemic meaning they are not found anywhere else in the world. These include the giant Galapagos tortoise, the marine iguana, the flightless cormorant and the Galapagos penguin – the only species of penguin that lives north of the equator.
- These species were observed by Charles Darwin during the voyage of the HMS Beagle in 1835 and inspired his theory of evolution by natural selection. To preserve the unique wildlife on the islands, the Ecuadorian government made the entire archipelago a national park in 1959.

Figure 31: The archipelago consists of 13 major islands and a handful of smaller islands and islets scattered across approximately 60,000 km2 of ocean. Repeated volcanic eruptions and ongoing seismic activity have helped form the rugged mountain landscape of the islands. In this image, captured on 23 September 2020, several circular volcanic cones can be seen atop the islands. This image is also featured on the Earth from Space video program (image credit: ESA, the image contains modified Copernicus Sentinel data (2020), processed by ESA, CC BY-SA 3.0 IGO)
• February 26, 2021: The Copernicus Sentinel-2 mission takes us over Vancouver – the third largest city in Canada. 51)
- In this image, captured on 29 July 2019, an unusually large quantity of sediment can be seen gushing from the Fraser River into the Strait of Georgia. The Fraser River is the longest river within British Columbia rising at Fraser Pass in the Rocky Mountains and flows for over 1300 km before emptying into the strait. The river's annual discharge at its mouth is estimated to be around 3550 m3/s, and is said to discharge around 20 million tons of sediment into the ocean.
- Several ships and vessels can be easily spotted at the top of the image, in the Burrard Inlet, which separates the city of Vancouver from the slopes of the North Shore Mountains (not visible).
- Vancouver Island dominates the left-side of the image. Covering an area of over 31 000 km2, it is the largest island on the Pacific coast of North America. The island is heavily wooded and mountainous with several peaks of more than 2100 m.
- At the bottom of the image, marine stratocumulus clouds can be seen over the Strait of Juan de Fuca, which also marks the international boundary between Canada and the Unites States. These types of cloud formations could be related to the Puget Sound Convergence Zone – a frequent weather phenomena where northwest winds are split by the Olympic Mountains and then re-converge over Puget Sound, visible in the bottom-right of the image.
- Copernicus Sentinel-2 is a two-satellite mission. Each satellite carries a high-resolution camera that images Earth’s surface in 13 spectral bands. The mission is mostly used to track changes in the way land is being used and to monitor the health of our vegetation.

Figure 32: Vancouver, visible at the top of the image, lies between the Burrard Inlet, an arm of the Strait of Georgia, to the north, and the Fraser River delta to the south. Vancouver has the highest population density in Canada, with over 5400 people/km2, making it the fifth-most densely populated city in North America. This image is also featured on the Earth from Space video program (image credit: ESA, the image contains modified Copernicus Sentinel data (2019), processed by ESA, CC BY-SA 3.0 IGO)
• February 19, 2021: After Etna’s powerful eruption on Tuesday 16 February, the volcano produced another spectacular display of fire – with tall lava fountains shooting into the night sky, reaching heights of around 700 m. The first eruption caused large lava flows to descend eastwards into the Valle del Bove, travelling for approximately 4 km, but the second major explosion on Thursday (Feb. 18) caused the lava also to run for about 1.3 km down the volcano’s southern flanks. 52)
- Ash from the eruptions covered the city of Catania and authorities have been monitoring developments in the nearby towns at the base of the volcano, including Linguaglossa, Fornazzo and Milo. The eruption also forced the temporary closure of Sicily’s Catania Airport, which often happens when the volcano is active.
- According to Volcano Discovery, which publishes frequent alerts about seismic activity, the volcano also saw activity earlier today, 19 February, with lava flows continuing to descend to the south and east. Mount Etna is the tallest active volcano in Europe and frequently erupts.
- Satellite data can be used to detect the slight signs of change that may foretell an eruption. Once an eruption begins, optical and radar instruments can capture the various phenomena associated with it, including lava flows, mudslides, ground fissures and earthquakes. Atmospheric sensors on satellites can also identify the gases and aerosols released by the eruption, as well as quantify their wider environmental impact.

Figure 33: Italy’s Mount Etna, one of the world’s most active volcanoes, has erupted twice in less than 48 hours, spewing a fountain of lava and ash into the sky. This image, captured yesterday 18 February 2021 at 09:40 GMT by the Copernicus Sentinel-2 mission, has been processed using the mission’s shortwave-infrared band to show the lava flow in bright red (image credit: ESA, the image contains modified Copernicus Sentinel data (2021), processed by ESA, CC BY-SA 3.0 IGO)
• February 19, 2021: The Copernicus Sentinel-2 mission takes us over Lusaka – the capital and largest city of Zambia. 53)
- Lusaka, visible at the top of the image of Figure 34, is located on a high plateau in south-central Africa with an elevation of around 1200 m. With a population of over 2 million people, Lusaka is one of the fastest developing cities in southern Africa. Lusaka National Park is easily identifiable as a brown patch of land just southeast of the city. The 6700 hectare park hosts a variety of rare and endangered animals.
- Owing to Zambia’s humid sub-tropical climate, agriculture is the country’s main source of income and jobs. The circular shapes in the image, visible mostly southwest of Lusaka in light green, are an example of pivot irrigation, or center-pivot irrigation systems. This type of irrigation functions where equipment rotates around a central pivot and crops are fed with water from the centre of the arc.
- Water from the nearby Kafue River, visible cutting across the image from left to right, is used for irrigation and hydroelectric power. At 1600 km long, the Kafue River is the longest river lying solely within Zambia. The river flows across the flat plain called Kafue Flats (also known as Butwa) and meanders in a maze of swampy channels and lagoons.
- The flats, visible in dark brown in the far-left of the image, are a shallow flood plain around 240 km long and about 50 km wide, and are usually flooded to a depth of less than one meter in the rainy season.
- From here, the Kafue River continues its journey southeast, flowing through the Kafue Gorge before finally joining the Zambezi River, visible in the bottom-right of the image, near Chirundu, Zimbabwe.

Figure 34: Data from the Copernicus Sentinel-2 mission can help monitor changes in urban expansion, land-cover change and agriculture monitoring. The mission’s frequent revisits over the same area and high spatial resolution also allow changes in inland water bodies to be closely monitored. This image, which was captured on 29 July 2019, is also featured on the Earth from Space program (image credit: ESA, the image contains modified Copernicus Sentinel data (2019), processed by ESA, CC BY-SA 3.0 IGO)
• February 12, 2021: For Valentine’s Day, the Copernicus Sentinel-2 mission takes us over Valentine Island in northern Western Australia. 54)
- The King Sound has one of the highest tides in Australia, and amongst the highest in the world, reaching a maximum tidal round of around 11 to 12 m. The Fitzroy River, one of Australia’s largest watercourses, along with the Lennard, Meda and Robinson Rivers, empty their muddy and sediment-laden waters into the Sound.

Figure 35: The tiny Valentine Island, visible in the top-left of the image, measures around 1.6 km in length and around 250 m wide. The island is located in the King Sound, a large gulf and inlet of the Indian Ocean in Australia’s Kimberley Region. The gulf is around 120 km long and averages about 50 km in width. This image is also featured on the Earth from Space video program (image credit: ESA, the image contains modified Copernicus Sentinel data (2020), processed by ESA, CC BY-SA 3.0 IGO)

Figure 36: These images show the result of the floods brought on by heavy rainfall that hit Western Australia in late 2020. The image on the left was captured on 11 November 2020, while the image on the right was taken around a month later, on 16 December 2020 (image credit: ESA, the image contains modified Copernicus Sentinel data (2020), processed by ESA, CC BY-SA 3.0 IGO)
- The heavy rain caused a large amount of sediment to be discharged into the Sound, as seen in dark shades of brown which contrast with the clearer, turquoise-colored waters visible at the top. The sediment has also been transported and deposited around Valentine Island.
- A myriad of mangrove estuaries can be seen scattered around the coast. Australia is surrounded by around 11,000 km of mangrove-lined coast, located primarily on the northern and eastern coasts of the continent. Mangroves contribute many environmental benefits to coastal and estuarine ecosystems; they provide food and habitats for a wealth of wildlife such as birds and fish.
- As more people move closer to coastal zones, the risk to mangroves increases. Greater pressure is placed on the mangrove environment from both direct and indirect sources such as dumping of waste, fish farming, sea level rise and climate change.
- Satellite missions such as Copernicus Sentinel-2 allow us to capture spectacular images such as these from space. This year, some of our incredible images of Earth from Space are now available as posters in the ESA On Demand shop. From the Amazon, to the Baltic Sea, to Antarctica, browse our new, Earth-inspired wall art for your home or office. Surprise someone special this Valentine’s Day with the special-edition image of the heart-shaped Moorea Island.
• February 5, 2021: The Copernicus Sentinel-2 mission takes us over the algal blooms swirling around the Pacific Ocean, just off the coast of Japan. 55)
- Algae blooms refer to the rapid multiplying of phytoplankton – microscopic marine plants that drift on or near the surface of the sea. Excessive algal growth, or algal blooms, can become visible to the naked eye and collectively tint ocean waters, allowing us to detect these tiny organisms from space.
- Although algal blooms are a natural and essential part of life in the sea, human activity is also said to increase the number of annual blooms. Harmful algal blooms can be stimulated by environmental factors, such as light, warmer water temperatures and excessive nutrients.
- During the spring bloom season, nutrients such as nitrates and phosphates are more abundant in the surface waters. Without direct in situ measurements, it is difficult to distinguish the type of algae that cover the ocean here. Algae is then usually carried by winds and currents closer to the coast of Japan.

Figure 37: In the image pictured here, captured on 14 June 2019, high concentrations of algae can be seen around 130 km off Hokkaido Island, the second largest island of Japan. This particular algal bloom measured more than 500 km across and 200 km wide, with the area pictured here showing just a small portion of the bloom, around 100 km from north to south and around 110 km from east to west. This image is also featured in this week's Earth from Space Program (image credit: ESA)

Figure 38: In the Pacific Ocean, near Hokkaido, Japan the colder Oyashio Current converges from the north with the warmer Kuroshio Current, which flows from the south. When two currents with different temperatures and densities collide, they often create eddies – swirls of water drifting along the edge of the two water masses. The phytoplankton growing atop the surface waters become concentrated along the boundaries of these eddies and trace out the motions of the water (image credit: ESA)
- Phytoplankton play an important role in the food chain, but they also have an impact on the global carbon cycle by absorbing carbon dioxide on a scale equivalent to that of terrestrial plants. Primary production is often used to describe the synthesis of organic material from carbon dioxide and water through photosynthesis. Even small variations in primary productivity can affect carbon dioxide concentrations, as well as influencing biodiversity and fisheries.
- As ocean surfaces warm in response to increasing atmospheric greenhouse gases, phytoplankton productivity will need to be monitored both consistently and systematically.
- Satellite data can not only be used to track the growth and spread of harmful algae blooms in order to alert and mitigate against damaging impacts for tourism and fishing industries, but have also recently proven fundamental to providing a global view of phytoplankton and their role in, and response to, climate change.
• January 29, 2021: Ahead of World Wetlands Day, the Copernicus Sentinel-2 mission takes us over Lake Titicaca – one of the largest lakes in South America. 56)
- Covering an area of around 8300 km2, Lake Titicaca lies on the high Andes plateau and straddles the border between Peru (to the west) and Bolivia (to the east). It is considered the highest major body of navigable water in the world, as it sits at an elevation of 3800 m above sea level.
- The lake extends approximately 190 km from northwest to southwest and is 80 km across at its widest point. Tiquina, a narrow strait, actually separates the lake into two separate bodies of water. The larger subbasin in the northwest is called Lake Chucuito in Bolivia and Lake Grande in Peru, while the smaller in the southeast is referred to as Lake Huiñaymarca in Bolivia and Lake Pequeño in Peru.
- Many rivers drain into the lake, including the Ramis, one of the largest, visible in the northwest corner of the lake. The smaller Desaguadero river drains the lake at its southern end, which then flows south through Bolivia. This outlet only accounts for a small percentage of the lake’s excess water, as the rest is lost by evaporation caused by persistent winds and intense sunlight.
- Lake Titicaca is a designated Ramsar Site of International Importance, as the waters of Titicaca are essential to the wellbeing of millions of people who rely on the lake for agriculture, fishing and tourism, as well as water birds and animals that live along and on its shores.
- February 2 marks the anniversary of the signing of the Convention on Wetlands of International Importance, known as the Ramsar Convention, in Ramsar, Iran in 1971. World Wetlands Day aims to raise global awareness about the vital role of wetlands for our planet and population.
- From their vantage point of 800 km high, Earth-observing satellites provide data and imagery on wetlands that can be used to monitor and manage these precious resources sustainably. For example, both the Copernicus Sentinel-2 and Sentinel-3 missions have recently been used to monitor the variation of chlorophyll concentrations in the lake and help detect trends and hotspots over time.

Figure 39: Forty-one islands rise from Titicaca’s waters, the largest of which, Titicaca Island, or Isla del Sol in Spanish, can be seen just off the tip of the Copacabana Peninsula in Bolivia. Several green algal blooms can be seen in the lake, including in the lake’s northwest and southeast corners. Snow in the Andes mountain range can be seen in the top-right of the image. This image is also featured on the Earth from Space video program (image credit: ESA, the image contains modified Copernicus Sentinel data (2020), processed by ESA, CC BY-SA 3.0 IGO)
• January 22, 2021: Sardinia, the second-largest island in the Mediterranean Sea, is featured in this false-color image captured by the Copernicus Sentinel-2 mission. 57)
- Sardinia (also known as Sardegna) is situated between the Mediterranean Sea to the west and south and the Tyrrhenian Sea to the east. The island sits 200 km west of the Italian Peninsula, 200 km north of Tunisia and around 12 km south of the French island of Corsica, partially visible in the top of the image.
- Sardinia is a mainly mountainous region, with its highest point Mount La Marmora in the Gennargentu massif visible in the centre-right of the image. With over 1800 km of coastline, Sardinia is internally renowned for its beaches including those along the Emerald Coast, or Costa Smeralda, Alghero and Villasimius. The coasts, particularly in the east, are high and rocky, with long stretches of coastline with bays, inlets and various smaller islands located off the coast.
- The archipelago of La Maddalena, including the renowned islands of La Maddalena, Caprera and Santo Stefano, can be seen in the top-right of the image. Its islands are known for their pristine beaches and wild beauty. Cagliari, the island’s capital and largest city, lies on the southern coast of the island.
- Copernicus Sentinel-2 is designed to provide images that can be used to distinguish between different crop types as well as data on numerous plant indices, such as leaf area index, leaf chlorophyll content and leaf water content – all of which are essential to accurately monitor plant growth.

Figure 40: This image, which uses data from 11 October to 14 October 2019, has been processed using the shortwave infrared band and the near infrared band to highlight dense vegetation. Crops and vegetation appear in bright green in the image, while bare soil can be seen in various shades of orange and brown. Grasslands and croplands with a higher moisture content appear more vibrant in the image. As water is a strong absorber of infrared, inland water bodies are delineated and can be easily spotted in black. Much of the Sardinia’s arable land is devoted to cereal cultivation and fruit growing. This image is also featured on the Earth from Space video program (image credit: ESA, the image contains modified Copernicus Sentinel data (2019), processed by ESA, CC BY-SA 3.0 IGO)
• January 15, 2021: The Copernicus Sentinel-2 mission takes us over the Tanezrouft Basin – one of the most desolate parts of the Sahara Desert. 58)

Figure 41: Tanezrouft is a region of the Sahara lying in southern Algeria and northern Mali. The hyperarid area is known for its soaring temperatures and scarce access to water and vegetation, a reason why it’s often referred to as the ‘Land of Terror’. There are no permanent residents that live here, only occasional Tuareg nomads. This image, also featured on the Earth from Space video program, was captured on 12 January 2020 by the Copernicus Sentinel-2 mission (image credit: ESA, the image contains modified Copernicus Sentinel data (2020), processed by ESA, CC BY-SA 3.0 IGO)
- The barren plain extends to the west of the Hoggar mountains and southeast of the sandy Erg Chech. The terrain shows evidence of water erosion that occurred many years ago, when the Sahara Desert’s climate was much wetter, as well as wind erosion caused by frequent sandstorms – exposing ancient folds in the Paleozoic rocks.
- The region is characterized by dark sandstone hills, steep canyon walls, salt flats (visible in white in the image), stone plateaus and seas of multi-storey sand dunes known as ‘ergs’. Concentric rings of exposed sandstone strata create a stunning pattern predominantly visible in the left of the image.
- White lines in the right of the image are roads that lead to In Salah – the capital of the In Salah Province and In Salah District. Just above the center-left of the image, an airstrip can be seen. An interesting, grid-like pattern can be seen in the bottom of the image and mostly consists of human-made clearings and roads.
• January 12, 2021: Captured by the Copernicus Sentinel-2 mission on 11 January 2021 at 12:14 CET, this image of Madrid in Spain appears to have been taken in black and white. In fact, it is a true-color image – but the heaviest snowfall in 50 years has blanketed the region, turning the landscape white. 59)
- Storm Filomena hit Spain over the weekend, blanketing parts of the country in thick snow and leaving half of the country on red alert. Madrid, one of the worst affected areas, was brought to a standstill with the airport having to be closed, trains cancelled and roads blocked.

Figure 42: Although this satellite image was taken after the storm had passed, it is clear to see that much snow still remains, especially in the outskirts of the city. For example, some runways at the airport, which is visible in the top-right of the image, are still covered by snow. The unusual cold weather on the Iberian Peninsula is expected to last until later this week with temperatures forecasted to plunge to –12ºC. The race is on to clear roads so that supplies of essential goods such as food supplies and Covid vaccines can be delivered (image credit: ESA, the image contains modified Copernicus Sentinel data (2021), processed by ESA, CC BY-SA 3.0 IGO)
• December 11, 2020: The Copernicus Sentinel-2 mission takes us over Kyiv – the capital and most populous city of Ukraine. 60)
- Kyiv, also spelled Kiev, is visible just below the center of the image, along the Dnieper River in north-central Ukraine. The city covers a total area of around 840 km2 and is home to approximately three million people.

Figure 43: Originally just on the west bank, today the city of Kyiv spreads across both sides of the Dnieper River, which flows southwards through the city. The Dnieper is the fourth-longest river in Europe, after the Volga, Danube and Ural rivers. It rises on the southern slopes of the Valdai Hills of Russia and flows in a southerly direction through western Russia, Belarus and Ukraine to the Black Sea. This image is also featured on the Earth from Space video program (image credit: ESA, the image contains modified Copernicus Sentinel data (2019), processed by ESA)
- Directly above the city of Kyiv is the Kyiv Reservoir – a large water reservoir which is 110 km in length and 12 km in width. The reservoir is mainly used for irrigation, hydroelectricity generation and industrial and public consumption.
- The neon green colors in the Kyiv Reservoir indicate a high quantity of algae. Algal blooms are dense layers of microscopic plants that occur on the surface of lakes, or other bodies of water, when there is an overabundance of nutrients on which algae depend. These high levels of nutrients are often caused by human pollution, such as wastewater or fertilizer runoff from agriculture.
- Owing to Ukraine’s climate and arable land, agriculture plays a large role in the country’s economy. Large, agricultural plots dominate this week’s image, with corn, wheat and barley being the country’s main crops. With over 40 million hectares of agricultural land covering 70% of the country, agriculture is Ukraine’s largest export industry.
• December 4, 2020: The Copernicus Sentinel-2 mission takes us over the Banks Peninsula on the South Island of New Zealand. 61)
- Banks Peninsula, visible in the bottom-right of the image, consists of two overlapping extinct volcanoes: the Lyttelton Volcano and the Akaroa Volcano. The peninsula was formed by several volcanic eruptions that took place around eight million years ago. The name of the peninsula comes from Sir Joseph Banks, a British biologist who sailed with Captain Cook.
- Breaches in the crater walls led to the formation of two long, thin harbors: Lyttelton in the north and Akaroa in the south. The peninsula also has many other smaller bays and coves, giving it its unusual, cogwheel shape. Christchurch, the largest city on South Island, is visible immediately north of Banks Peninsula.
- The Rangitata, Rakaia and Waimakariri are the principal rivers visible in the image flowing southeast from the Southern Alps. The Rakaia river, visible in the center of the image, is one of the largest braided rivers in New Zealand. The river travels for around 150 km before entering the Pacific Ocean. The turquoise colors visible in the ocean suggest the presence of sediment being carried into the ocean by river discharge, as well as algal blooms.
- Between Rakaia river and the Banks Peninsula, lies Lake Ellesmere (Te Waihora). The lake is actually a shallow, coastal lagoon, with its emerald green colors most likely due to a high concentration of chlorophyll. The long stretch of land, visible in brown south of the lagoon, is the Kaitorete Spit and is a barrier that separates the lagoon from the Pacific Ocean.

Figure 44: The Banks Peninsula's jagged coastline heavily contrasts with the adjoining, flat Canterbury Plains. Extending around 80 km inland from the coast to the foothills of the Southern Alps, visible in the top-left of the image, the plains are a rich agricultural region known for wheat and barley, as well as wool and livestock. This Sentinel-2 image, captured on 4 January 2019, is also featured on the Earth from Space video program (image credit: ESA, the image contains modified Copernicus Sentinel data (2019), processed by ESA, CC BY-SA 3.0 IGO)
• November 27, 2020: In this week's edition of the Earth from Space program, the Copernicus Sentinel-2 mission takes us over Kiruna, the northernmost town in Sweden. 62)

Figure 45: Kiruna, visible in darker tones just left of the center in the snow-covered image, is located in the county of Norrbotten and is around 145 km north of the Arctic Circle. The city, with a population of around 22,000 inhabitants, is on the eastern shore of Lake Luossa (Luossajärvi), between the iron-ore Kiruna (Kiirunavaara) and Luossa (Luossavaara) mountains. A Sentinel-2 spacecraft captured this image on 27 May 2020. It is also featured on the Earth from Space video program (image credit: ESA, the image contains modified Copernicus Sentinel data (2020), processed by ESA, CC BY-SA 3.0 IGO)
- Around 20 km east of Kiruna, the small town of Jukkasjärvi is visible, and is best known for its annual ice hotel constructed from snow and ice blocks taken from the nearby Torne River. Thin, dark lines cutting across the image are roads that connect the towns with other parts of Sweden.
- At a latitude of almost 68º, around 40 km east of Kiruna, lies ESA’s Kiruna ground station, which in September 2020 celebrated 30 years of space excellence. The station is hard to spot, but is located in the center-right of the image, just above a dark lake.
- Ideally positioned to support polar-orbiting missions, the station is a crucial gateway for much of the data enabling us to study our planet’s oceans, water and atmosphere, forecast weather and understand the rapid advance of climate change.
- Kiruna ground station is part of the Agency’s tracking station network – Estrack – a worldwide network linking satellites in orbit and across the Solar System with ESA’s Space Operations Centre, ESOC, in Darmstadt, Germany. The station features two sophisticated terminals with 15 m and 13 m-diameter antennas to communicate with satellites in Earth’s orbit, including CryoSat, Swarm, Copernicus Sentinel-1 and the recently-launched Sentinel-6 Michael Freilich satellite.
- While the North Pole Satellite Station in Alaska caught the spacecraft’s first signals from space after separation from the launcher, the Kiruna ground station tracked the satellite’s first days. EUMETSAT then completed the final ‘orbit acquisition,’ taking over responsibility for commissioning, routine operations and distribution of the mission’s vital data.
- While Sentinel-6 is one of the European Union’s family of Copernicus missions, its implementation is the result of the unique collaboration between ESA, NASA, EUMETSAT and NOAA, with contribution from the French space agency CNES.
• November 20, 2020: The Vandenberg Air Force Base, in California, US, where the Copernicus Sentinel-6 Michael Freilich satellite will soon launch from, is featured in this image captured by the Copernicus Sentinel-2 mission. 63)

Figure 46: The area pictured here shows the Santa Barbara County in the southern region of the US state of California. Located around 200 km northwest of Los Angeles, the county spans across 7,000 km2 and is bordered by the Pacific Ocean to the west and south. This image, captured on 14 August 2020, is also featured on the Earth from Space video program (image credit: ESA, the image contains modified Copernicus Sentinel data (2020), processed by ESA, CC BY-SA 3.0 IGO)
- The county includes the coastal city of Santa Barbara, partially visible in the lower right of the image. Santa Barbara lies between the steeply rising Santa Ynez Mountains, visible in dark green directly above, and the Pacific Ocean. The mountains rise dramatically behind the city with several peaks exceeding 1200 m.
- Other mountain ranges in the county include the San Rafael Mountains, visible directly above, and the Sierra Madre Mountains. Most of the mountainous area is within the Los Padres National Forest – California’s second largest national forest.
- The county’s most populous city is Santa Maria, visible in the top left of the image, surrounded by a patchwork of agricultural plots. Like many other cities in California, Santa Maria experiences a Mediterranean climate.
- Below Santa Maria lies the Vandenberg Air Force Base – visible along the coast. It is here, where the Copernicus Sentinel-6 Michael Freilich satellite will launch from. A joint European-US satellite built to monitor sea levels, the satellite will liftoff atop a Space X Falcon 9 rocket on 21 November at 18:17 CET (09:17 PST). The satellite, named after Michael Freilich, the former NASA director who advocated for advancing satellite measurements, will extend a nearly 30-year continuous dataset on sea level.
- It will be the first ESA-developed satellite to be given a ride into space on the SpaceX Falcon 9 rocket. Famously, Falcon 9 is partially reusable – unlike most rockets which are expendable launch systems. Once in orbit some 1336 km above Earth, the Sentinel-6 Michael Freilich satellite will collect sea level measurements for 95% of Earth’s ice-free oceans. The data will be essential for climate science, policy-making and protecting those in low-lying regions.
• November 13, 2020: The Copernicus Sentinel-2 mission takes us over Darmstadt – home to ESA’s ESOC (European Space Operations Centre). 64)

Figure 47: The image pictured here shows the Frankfurt Rhine-Main region in south-central Germany. With a population of almost six million people, the region includes the main cities of Frankfurt, Wiesbaden, Offenbach and Darmstadt. Frankfurt, Germany’s fifth-largest city, is visible at the top of the image, located on both sides of the Main River. The southern part of the city contains the Frankfurt City Forest, the largest inner-city forest in Germany, visible in dark green. Frankfurt Airport can be easily spotted southwest of the city center. This image, captured on 23 June 2020, is also featured on the Earth from Space video program (image credit: ESA, the image contains modified Copernicus Sentinel data (2020), processed by ESA, CC BY-SA 3.0 IGO)
- The Rhine River can be seen in the left of the image. The river flows for around 1230 km in a northerly direction through Germany and the Netherlands, before emptying into the North Sea. Darmstadt is located between the Rhine and the Odenwald, a forested plain in the bottom-right of the image. Darmstadt is often referred to as a ‘City of Science,’ as it’s a major centre of scientific institutions including ESA’s European Space Operations Centre (ESOC) and the European Organisation for the Exploitation of Meteorological Satellites (EUMETSAT).
- ESOC is home to the engineering teams that control spacecraft in orbit and across the Solar System. On 21 November, the Copernicus Sentinel-6 Michael Freilich ocean-monitoring satellite will launch on a Space X Falcon 9 rocket from California, US, and once safely in orbit, ESA’s ESOC Operations Centre will take over the reins.
- Copernicus Sentinel-6 Michael Freilich will replace the Jason series of satellites currently providing data on Earth’s oceans. Over the subsequent days after launch, the Sentinel-6 mission control team will maneuver the satellite into its correct path, which will fly in tandem with the Jason-3 spacecraft it will replace, and then fall into position right behind it.
- Once the Sentinel is through the critical early phase and drifts towards its target orbit, EUMETSAT will complete the final ‘orbit acquisition’ and take on responsibility for commissioning, routine operations and distribution of the mission’s vital data.
- Copernicus Sentinel-6 will join a fleet of Earth’s monitoring spacecraft in the low-Earth orbit – flying at a mean altitude of 1336 km. ESA’s Space Debris Office, also based at ESOC, will be on-hand through the critical early days, monitoring and calculating the risk of collisions with swirling space debris and advising on how to keep the mission safe.
• November 12, 2020: Data from the Copernicus Sentinel satellites are enabling the national monitoring of agricultural activity in Poland – a colossal task that will support the efforts of key national agencies to assess a country’s cropland, productivity, and food security, as well as the implementation of the EU Common Agricultural Policy in years to come. 65)
- The data, acquired by the Copernicus Sentinel-1 and Sentinel-2 satellites and processed by ESA’s EOStat project, are being used by Statistics Poland, the country’s Central Statistical Office (or GUS – Glowny Urzad Statystyczny).
- EOStat aims to bring together ground-based and Earth observation tools to collect agricultural information, with the Sentinels being a key component. Together, these Sentinels image land and sea at a high resolution, identifying characteristics such as vegetation type, soil cover, and waterways from space.
- Monitoring and assessing agricultural data is an essential task, and typically performed once a year in Poland via Statistics Poland's agricultural survey. This survey is also scaled up every decade, as it is in 2020, in the form of a Decadal Agricultural Census supported by Eurostat (the EU’s statistical office), which collects some 300 variables covering different aspects of farming such as general farmland characteristics, livestock, the labor force, animal housing, and support measures for rural development.
- Therefore, while essential, this task is also immense – especially so given that Poland has some of the most agricultural holdings (over 1.5 million) and arable land (14.7 million hectares) within the EU-27, and is also the fifth-largest beneficiary of the EU Common Agricultural Policy (CAP).
- The agricultural census traditionally comprises field and household surveys, but, this year, will be able to make the most of Sentinel data to characterize geospatial and crop type characteristics in Poland.

Figure 48: EOStat mapping of crop type in Poland. These two maps show the various crop types identified and mapped in the 2019 and 2020 vegetation seasons in Poland by the ESA EOStat project, which uses data from the Copernicus Sentinel-1 and Sentinel-2 satellites. Crop types explored: barley (spring and winter), wheat (spring and winter), triticale (spring and winter), rapeseed (spring and winter) buckwheat, oat, rye, maize, grassland and other. The same five regions are also identified in each map (for 2019 and 2020: Żuławy Wiślane, Wiekopolska północ, Podlasie, Wielkopolska południe and Dolnośląskie), with a closer view of crop diversification shown in the inset boxes. The map scale is shown to the bottom center (in kilometers), image credit: EOStat (ESA/IGiK/CBK PAN)
- “Implementing large-scale crop identification and monitoring with Copernicus data is a backbone of our strategy to improve the accuracy and effectiveness of agriculture statistics,” says Artur Łączyński, Director of Statistics Poland’s Agriculture department. The data and services developed in the EOStat project will also be used to support the national paying agency – ARiMR – responsible for implementing the EU CAP in Poland.
- “The EOStat project is a big step towards country-scale monitoring of agriculture at the field level,” adds Jedrzej Bojanowski of the Institute of Geodesy and Cartography (IGiK), Poland, and EOStat Project Coordinator. “We have developed novel algorithms for classifying crop types, monitoring agricultural activity, and forecasting crop yields for the main administrative units, and optimized these algorithms so they can be applied across the entire country.”

Figure 49: These two charts show the various crop types identified and monitored in the 2019 and 2020 vegetation seasons in Poland by the ESA EOStat project, which uses data from the Copernicus Sentinel-1 and Sentinel-2 satellites. Crop types explored: barley (spring and winter), wheat (spring and winter), triticale (spring and winter), rapeseed (spring and winter) buckwheat, oat, rye, maize, grassland and other [image credit: EOStat (ESA/IGiK/CBK PAN)]
- Drawing from Sentinel data, EOStat provides information on the spatial extent of the 13 most popular crops in Poland – eight cereals, winter and spring rapeseed, buckwheat, maize and grasslands – and employs a novel methodology able to monitor small, irregular parcels of agricultural land (a particular issue in Poland, where over half of the country's parcels do not exceed five hectares).
- The products generated by EOStat will become a key element of Statistics Poland's new large-scale system for assessing crop condition, type, and potential yield, which will be the basis of Poland’s agricultural statistics reporting process after 2021.
- “This project shows just how well Sentinel satellites fit both national and European needs for quality data and information services,” says Anna Burzykowska, ESA Technical Officer. “In the span of only two years we have managed to define and deliver complete end-to-end data processing chains based on the synergistic use of Sentinel and in situ data to support various assessments related to official statistics, national food security and natural capital accounting. EOStat truly demonstrates the tremendous Europe-wide value of the Sentinels.”
- Up to 18 terabytes of data were processed for the 2019 and 2020 vegetation seasons using CreoDIAS, a cloud infrastructure designed and adapted to process large amounts of EO data.

Figure 50: This image shows some of the EOStat project’s key figures at a glance, including the amount of Sentinel data processed, crop types classified, and the extent of agricultural land in Poland. The EOStat team developed a new, computationally efficient algorithm based on Copernicus Sentinel-2 data to verify whether an agricultural parcel is cultivated or not. For each of the 6 million suitable parcels of land, information is provided on the sowing and harvesting dates of main and catch-crops, together with the delineation of parcels susceptible to erosion (meeting the monitoring requirements of the new EU Common Agricultural Policy, and providing indication for the effectiveness of its soil conservation measures), image credit: EOStat (ESA/IGiK/CBK PAN)
- “It took just six days to process the data for one season thanks to our direct access to Sentinel data and the large processing power of CreoDIAS," says Edyta Woźniak of the Polish Academy of Sciences’ Space Research Center (CBK PAN), who led the EOStat crop identification effort. “On our local machines it could take as long as five weeks.”
- Josef Aschbacher, ESA’s Director of Earth Observation Programs, added, "Information from the Sentinels is finding a myriad of uses to improve daily lives. I am thrilled that both Sentinel-1 and Sentinel-2 missions are enabling the monitoring of agricultural activity on a national scale. The data is vital to monitoring food security and supporting the implementation of the Common Agricultural Policy.”
- Ultimately, EOStat aims to provide Statistics Poland with the ability to regularly acquire, process, and use EO data, and to support ARiMR monitoring of crop diversification, agricultural activity, and Ecological Focus Areas (as ESA also does via Sen4CAP). EOStat is led by a scientific consortium of remote sensing specialists from IGiK and CBK PAN, and financed by ESA’s Polish Industry Incentive Scheme and Earth Observation Envelope Program-5.

Figure 51: Next-generation monitoring of agricultural activity in Poland. Data from the Copernicus Sentinel satellites are enabling the national monitoring of agricultural activity in Poland – a colossal task that will support the efforts of key national agencies to assess a country’s cropland, productivity, and food security, as well as the implementation of the EU Common Agricultural Policy in years to come. The data, acquired by the Copernicus Sentinel-1 and Sentinel-2 satellites and processed by ESA’s EOStat project, is being used by Statistics Poland, the country’s Central Statistical Office (or GUS – Glowny Urzad Statystyczny). The products generated by EOStat will become a key element of Statistics Poland's new large-scale system for assessing crop condition, type, and potential yield, which will be the basis of Poland’s agricultural statistics reporting process after 2021 (image credit: pixabay / marcinjozwiak)
• October 16, 2020: The Copernicus Sentinel-2 mission takes us over Zeeland – the westernmost province in the Netherlands. 66)
- Located around 150 km from Amsterdam, Zeeland consists of a complex system of islands, peninsulas and waterways. It also comprises Zeeuwsch-Vlaanderen – a strip of the Flanders mainland between the Western Scheldt (Westerschelde) and Belgium.
- The province of Zeeland lies on the large river delta at the mouth of several rivers, like the Scheldt (Schelde) and Meuse (Maas) rivers. The lighter aqua colors in the image depict the shallow waters of the delta with riverbeds and several sandbanks visible. The brown colored waters indicate a higher sediment content, which contrasts with the darker waters of the North Sea.
- The Port of Rotterdam, the largest seaport in Europe, is visible top-right in the image. Antwerp, in Belgium, is visible in the bottom-right and the quaint city of Bruges can be seen in the bottom-left of the image.
- Zeeland is one of the main agricultural provinces in the Netherlands with one of the largest areas of arable farmland. The patchwork of agricultural fields visible on the islands and mainland show the fields in the various stages of growth or harvest. The area supports cereals, potatoes, beets, cattle and horticulture.
- Large parts of Zeeland, which translates to ‘sea land,’ lie below sea level. The province was the site of a deadly flood in 1953 brought on by a combination of high spring tides and a strong windstorm that severely damaged the low-lying coastal region.
- As a result, the Dutch government began to implement the Delta Project – an elaborate system of dykes, canals, dams and bridges to hold back the North Sea. In this image, the 9 km-long Eastern Scheldt Storm Surge Barrier (Oosterscheldekering) is visible between the islands of Schouwen-Duiveland and Noord-Beveland.
- Since sea-level rise is a key indicator of climate change, accurately monitoring the changing height of the sea surface over decades is essential for climate science, for policy-making and, ultimately, for protecting the lives of those in low-lying regions at risk.

Figure 52: Sentinel-2 image of Zeeland, the westernmost province in the Netherlands. This image, acquired on 30 May 2020, is also featured on the Earth from Space video program (image credit: ESA, the image contains modified Copernicus Sentinel data (2020), processed by ESA, CC BY-SA 3.0 IGO)
- The Copernicus Sentinel-6 Michael Freilich satellite, set to launch in November, is the first of two identical satellites to be launched sequentially to provide accurate measurements of sea level change.
- Both satellites will reach 66°N and 66°S – a specific orbit occupied by the earlier missions that supplied the reference sea-surface height data over the last three decades. This orbit will allow for 95% of Earth’s ice-free ocean to be mapped every 10 days.
• October 9, 2020: Part of the Laguna San Rafael National Park, located on the Pacific coast of southern Chile, is pictured in this image captured by the Copernicus Sentinel-2 mission. 67)
- Covering an area of around 17000 km2, the park includes the Northern Patagonian Ice Field – a remnant of the Patagonian Ice Sheet that once covered the region. Today, despite the ice field being just a small fraction of its previous size, it is still the second largest continuous mass of ice outside of the polar regions.
- The glacier calves west towards the Pacific Ocean and into the Laguna San Rafael (Lake San Rafael), visible directly to the left of the glacier. The lake was formed due to the retreat of the glacier after the last ice age, and today is a popular tourist destination, with ships sailing to the lagoon to see ice falling from the glacier.
- Directly below lies the San Quintín glacier, the second-largest glacier in the northern ice field. The glacier drains to the west, where hundreds of icebergs can be seen dotted in the lake. Until 1991, the glacier terminated on land, but with its retreat, the basin filled with water and formed the proglacial lake we see today.
- Together with its twin, San Rafael, the glaciers have been receding dramatically under the influence of global warming. Satellite data show that some of the glaciers in Patagonia are retreating faster than anywhere in the world. As temperatures rise and glaciers and ice sheets melt, the water eventually runs into the ocean, causing sea level to rise.
- According to a report last year, glaciers worldwide have lost over 9000 gigatons of ice since 1961 – raising sea level by 27 mm. Rising seas are one of the most distinctive and potentially devastating effects of Earth’s warming climate.

Figure 53: The image depicts the west part of the Northern Patagonian Ice Field which has 28 exit glaciers, with the largest two, San Rafael and San Quintín, visible here. San Rafael Glacier, which can be seen in the upper-right of the image, is one of the most actively calving glaciers in the world and the fastest-moving glacier in Patagonia – ‘flowing’ at a speed of around 7.6 km per year. This image is also featured on the Earth from Space video program (image credit: ESA, the image contains modified Copernicus Sentinel data (2018), processed by ESA, CC BY-SA 3.0 IGO)
- For the last 30 years, a series of satellites have collected global sea level measurements to keep an eye on its rising trend. Scheduled for launch in November 2020, the Copernicus Sentinel-6 Michael Freilich satellite will be the next spacecraft to continue the long-term record of sea-surface height measurements started in 1992.
- The satellite will collect the most accurate data on sea level and monitor how it changes over time. The satellite carries a radar altimeter, which works by measuring the time it takes for radar pulses to travel to Earth’s surface and back again to the satellite.
- The spacecraft also carries five instruments to help monitor atmospheric conditions that affect the radar signal and to determine the precise position and velocity of the satellite in orbit. Other instruments measure atmospheric temperature and humidity profiles for weather forecasting and the radiation environment around the satellite.
• October 2, 2020: With a population of over 8 million people distributed over an area of around 780 km2, New York City is the most densely populated major city in the US. Situated on one of the world’s largest natural harbors, New York City is composed of five boroughs. 68)
- New York City’s 900 km of shoreline border the ocean, rivers, inlets and bays, and a harbor that is home to one of the largest ports on the east coast. Like many other cities that border an ocean, New York is at risk of flooding due to rising sea levels.
- Data show that since 1993, the global mean sea level has risen, on average, just over 3 mm every year. Even more worryingly, this rate of rise has increased in recent years.
- Sea level rise flooding of US coastlines is becoming more frequent each year. Rising sea levels are expected to worsen storm flooding in low-lying neighborhoods in coastal areas, and permanently inundate some parts. Retreating shorelines and accelerating erosion will threaten coastal homes and businesses.
- The upcoming Copernicus Sentinel-6 Michael Freilich satellite, set to launch in November from the Vandenberg Air Force Base in California, US, is the first of two identical satellites that will provide observations of sea level change.
- Each Sentinel-6 satellite carries an altimeter that works by measuring the time it takes for radar pulses to travel to Earth’s surface and back again to the satellite. Combined with precise satellite location data, altimetry measurements yield the height of the sea surface.

Figure 54: In this image, captured on 26 August 2019, the island of Manhattan is visible in the center, bounded by the Hudson, East and Harlem rivers. In the middle of Manhattan, Central Park can be seen as a long, green rectangle with a large lake in the middle. The Brooklyn and Queens boroughs can be seen on the right. John F. Kennedy International Airport – the busiest international air passenger gateway into North America – can easily be identifiable in the lower right of the image. The Bronx is visible north of Manhattan, while Staten Island can be seen in the lower left of the image. New Jersey dominates the upper left side of the image. This image is also featured on the Earth from Space video program (image credit: ESA, the image contains modified Copernicus Sentinel data (2019), processed by ESA, CC BY-SA 3.0 IGO)
• September 25, 2020: The Copernicus Sentinel-2 mission takes us over the Tarawa Atoll in the Republic of Kiribati – a remote Pacific nation threatened by rising seas. 69)
- The Republic of Kiribati is an independent island nation consisting of some 33 atolls near the equator in the central Pacific. The islands are spread over approximately 3.5 million km2 of ocean, but with a total land area of only 800 km2.
- South Tarawa, is made up of a thin, string of islets joined by causeways and is home to more than half of Kiribati’s 100,000 citizens. Bonriki International Airport, serves as the main gateway to the country, and can be seen in the bottom right of the image.
- Kiribati is one of the lowest-lying nations in the world, with many of the country’s atolls and coral islands rising no higher than 2 m above sea level – making them extremely vulnerable to sea level rise. Kiribati has already seen growing damage from storms and flooding. In 1999, two of the nation’s unpopulated islets, Tebua Tarawa and Abanuea, disappeared underwater entirely.
- The Special Report on the Ocean and Cryosphere in a Changing Climate on sea level rise states that the global mean sea level is likely to rise between 0.29 m and 1.1 m by the end of this century. While this may not sound like a lot, small island nations, including Kiribati, will face particularly devastating consequences.
- Small changes in sea-level rise will not only cause flooding, erosion, soil contamination and coral degradation, but will ultimately shrink more of Kiribati’s land area – displacing many of its inhabitants.
- It is vital that over the coming decades, the changing height of Earth’s sea surface continues to be closely monitored. Set to launch in November, the Copernicus Sentinel-6 Michael Freilich satellite will accurately measure changes in global sea level. Mapping up to 95% of Earth’s ice-free ocean every 10 days, it will provide key information on ocean currents, wind speed and wave height for maritime safety.
- This new satellite will assume the role as a reference mission, continuing the ‘gold standard’ record for climate studies started in 1992 – extending the legacy of sea-surface height measurements until at least 2030.

Figure 55: Tarawa Atoll, pictured here, lies approximately halfway between Hawaii and Australia. Tarawa consists of a large lagoon fringed by a V-shaped reef, around 35 km long, and is made up of more than 30 islets. Tarawa, the site of a brutal World War II battle, is divided into North and South Tarawa. This image, acquired on 14 June 2020, is also featured on the Earth from Space video program (image credit: ESA, the image contains modified Copernicus Sentinel data (2020), processed by ESA, CC BY-SA 3.0 IGO)
• September 18, 2020: The Copernicus Sentinel-2 mission takes us over the Vatnajökull ice cap, in southeast Iceland, in this summery image captured on 6 July 2019. 70)
- The most prominent outlet glaciers of Vatnajökull include Dyngjujökull in the north, Breiðamerkurjökull, and Skeiðarárjökull to the south. Vatnajökull conceals some of the most active volcanoes in the country, of which Bárðarbunga is the largest and Grímsvötn the most active. Periodic eruptions of these volcanoes melt the surrounding ice and create large pockets of water, which can often burst the weakened ice causing glacial floods, or ‘jökulhlaup’ in Icelandic.
- During these jökulhlaups, the glacier’s meltwater carries sediments and sands composed of ash to the coast. These outwash plains are called ‘sandurs’ and are commonly found in Iceland. Skeiðarársandur, the large area of black sand, visible south of the Skeiðarárjökull outlet glacier, covers an area of around 1300 sq km and was formed as the glacial rivers in the area washed ash and ice towards the sea.
- In the bottom-right of the image, on the southern side of Vatnajökull, the Jökulsárlón glacial lake, dotted with icebergs, is visible. Jökulsárlón began to form when the Breiðamerkurjökull glacier began retreating from the Atlantic Ocean owing to rising temperatures.
- The lake has grown considerably over time because of the melting of the glacier. It now covers an area of around 18 sq km, and with a maximum depth of around 250 m, it is considered Iceland’s deepest lake. The lake connects with the ocean and is, therefore, composed of both seawater and freshwater – causing its unique color.

Figure 56: Covering an area of around 8400 km2, which is three times the size of Luxembourg, Vatnajökull is not only classified as the biggest glacier in Iceland, but the biggest in Europe. With an average ice thickness of around 900 m, the ice cap has about 30 outlet glaciers – many of which are retreating owing to warming temperatures. This image is also featured on the Earth from Space video program (image credit: ESA, the image contains modified Copernicus Sentinel data (2019), processed by ESA)
• September 17, 2020: Researchers from the University of Oslo have applied a technique to extract the detailed flow field of Khumbu icefall in the Nepalese mountains, from a large collection of Copernicus Sentinel-2 data — helping climbers ascend Mount Everest. 71) 72)
- When high altitude mountaineers want to climb Mount Everest from the Nepalese side, they follow a route over and along Khumbu glacier. Part of the glacier, the icefall, runs over a steep cliff making it extremely dangerous. Around Everest basecamp, the glacier of Khumbu starts to receive clean, blueish ice that stems from snow and ice from Western Cwm, the highest glacier in the world.
- However, this ice reaches basecamp by transport through Khumbu icefall. This is a part of the glacier that runs over a steep cliff, and like a river undergoes chaotic and fast flow as it moves downwards. It is this section that climbers need to go through, in order to reach the summit of Mount Everest.
- Khumbu icefall involves a climb of nearly one thousand meters in elevation gain, mostly through a landscape full of crevasses, large pillars and ice walls. Luckily, a path is created through this turbulent environment by trained Nepali workers, called ice doctors.
- Every year before the climbing season starts, they explore routes and lay ropes along them, placing aluminum ladders over the crevasses. The icefall is constantly moving, so throughout the climbing season crevasses will open and close. Consequently, the team of ice doctors stay in Everest basecamp to be able to maintain the route through the icefall and re-secure ladders and ropes.
- Crevasses on a glacier originate when a certain shear strength is reached (when there is a difference in velocity). Thus, in general, the faster ice flow in the middle of a glacier will generate crevasses on its sides, but when the flow over the whole glacier surface is known, these regions can be mapped accordingly.
- The velocity pattern can thus be used to map dangerous areas on a glacier. Use of satellites for this purpose is evident, as these regions are very dangerous to access. Fortunately, it is possible to observe glacier flow from space. But over the fast moving icefall of Khumbu glacier this had not been possible yet, because the glacier ice funnels through a narrow corridor of rock, causing disorderly fracture ice to flow downward and making feature tracking difficult.

Figure 57: In this Copernicus Sentinel-2 image of Mount Everest, the eastern side of the mountain is obstructed by clouds, while the normal route from the Nepalese side is clearly visible. The GPS trajectories of the climbers on this route are plotted in purple (image credit: ESA, the image contains modified Copernicus Sentinel data (2020), processed by the Department of Geosciences, University of Oslo)
- Thanks to a large collection of data from the Sentinel-2 satellites of the European Union's Copernicus Program, the researchers extracted the detailed flow field of Khumbu icefall.
- Copernicus Sentinel-2 multispectral optical imagery at high spatial resolution supports a large range of applications such as precision farming, forestry management, water quality monitoring, and natural disasters management.
- The researchers exploited the high temporal revisit of high-resolution satellite images using a novel image matching technique, ensemble matching, making it possible to generate a high-resolution (30 m) velocity field from high-repeat image sequences despite challenging image conditions.
- Bas Altena, lead author of the study and researcher at University of Oslo found this specific application, and emphasized, "We used multiple optical imagery altogether, taking advantage of the high repeat rate of Copernicus Sentinel-2. This mission with two satellites in orbit can already generate a detailed time-series of glacier velocity for large glaciers, but for smaller and fast flowing sections the current algorithms are challenged. 73)
- "Our approach can provide solutions to these demanding situations, enhancing the capabilities of Copernicus Sentinel-2 towards a reliable and consistent glacier mapping instrument, with operational performance. We hope that our results, be it little, can be of help to the ice doctors for managing the route through the icefall," concluded Dr Altena.

Figure 58: Color-coded icefall velocities at Khumbu Glacier. 3D rendering of the extracted velocity field over Khumbu icefall. The trail to basecamp and through the icefall is indicated by the black line (image credit: Bas Altena, University of Oslo)
• September 15, 2020: This series of four Copernicus Sentinel-2 images captured between 29 June and 24 July 2020, shows a segment of the largest ice shelf in the Arctic break up and shatter into a flotilla of small icebergs totalling an area of around 125 km2. 74)

Figure 59: The Nioghalvfjerdsfjorden Ice Shelf, also known as 79N, is the floating front end of the Northeast Greenland ice stream - where it flows off the land and out into the ocean. At its leading edge, the 79N glacier splits in two, with offshoot turning north. It's this offshoot, or tributary, called Spalte Glacier, that has now disintegrated (image credit: ESA, the image series contains modified Copernicus data (2020), processed by ESA)
- With climate change taking a grip, Spalte Glacier’s final separation from the 79N Ice Shelf comes after some years of progressive disintegration. 79N has retreated by about 23 km since 1990, with significant losses over the last two record-breaking warm summers. Numerous ponds can also be seen on top of the remaining ice shelf, a sign of melting in the recent warm air temperatures. The ocean waters beneath the shelf are also likely to have warmed, increasing the risk of melt from below.
- 79N only recently took claim of being the Arctic’s largest ice shelf after the Petermann glacier, also in northwest Greenland, lost a lot of ice in 2010 and 2012.
• September 4, 2020: The Copernicus Sentinel-2 mission takes us over the Gulf of Kutch – also known as the Gulf of Kachchh – an inlet of the Arabian Sea, along the west coast of India. 75)
- The Gulf of Kutch divides the Kutch and the Kathiawar peninsula regions in the state of Gujarat. Reaching eastward for around 150 km, the gulf varies in width from approximately 15 to 65 km. The area is renowned for extreme daily tides which often cover the lower lying areas – comprising networks of creeks, wetlands and alluvial tidal flats in the interior region.
- Gujarat is the largest salt producing state in India. Some of the white rectangles dotted around the image are salt evaporation ponds which are often found in major salt-producing areas. The arid climate in the region favors the evaporation of water from the salt ponds.
- Just north of the area pictured here, lies the Great Rann of Kutch, a seasonal salt marsh located in the Thar desert. The Rann is considered the largest salt desert in the world.
- The Gulf of Kutch has several ports including Okha (at the entrance of the gulf), Māndvi, Bedi, and Kandla. Kandla, visible on the northern peninsula in the left of the image, is one of the largest ports in India by volume of cargo handled.
- The gulf is rich in marine biodiversity. Part of the southern coast of the Gulf of Kutch was declared Marine Sanctuary and Marine National Park in 1980 and 1982, respectively – the first marine conservatory established in India. The park covers an area of around 270 km2, from Okha in the south (not visible) to Jodiya. There are hundreds of species of coral in the park, as well as algae, sponges and mangroves.

Figure 60: This Sentinel-2 image, acquired on 4 April 2020, is also featured on the Earth from Space video program (image credit: ESA, the image contains modified Copernicus Sentinel data (2020), processed by ESA, CC BY-SA 3.0 IGO)
• August 11, 2020: The island of Mauritius has declared a ‘state of environmental emergency’ after a grounded vessel began leaking tonnes of oil into the Indian Ocean. Satellite images, which show the dark slick spreading in the nearby waters, are being used to monitor the ongoing spill. 76)
- The MV Wakashio vessel, reported to be carrying nearly 4000 tons of oil, ran aground on a coral reef on Mauritius’s southeast coast on 25 July. According to media reports, more than 1000 tons of fuel have leaked from the cracked vessel into the ocean – polluting the nearby coral reefs, as well as the surrounding beaches and lagoons.
- In response to the spill, the International Charter Space and Major Disasters was activated on 8 August. The charter is an international collaboration that gives rescue and aid workers rapid access to satellite data in the event of a disaster. A full report that provides a preliminary assessment of the oil spill, using imagery from the Copernicus Sentinel-2 mission, is available here.

Figure 61: In this image, captured on 11 August by the Copernicus Sentinel-2 mission, the MV Wakashio, visible in the bottom of the image, is stranded close to Pointe d’Esny, an important wetland area. The oil slick can be seen as a thin, black line surrounded by the bright turquoise colors of the Indian Ocean. Oil is visible near the boat, as well as other locations around the lagoon (image credit: ESA, the image contains modified Copernicus Sentinel data (2020), processed by ESA, CC BY-SA 3.0 IGO)
• August 5, 2020: Satellite images have revealed that there are nearly 20% more emperor penguin colonies in Antarctica than previously thought. Scientists, at the British Antarctic Survey, have used satellite data from the Copernicus Sentinel-2 mission to track penguin guano, or penguin poo, to monitor the presence of thousands of penguins. 77)
- The findings, published today in Remote Sensing in Ecology and Conservation, reveal 11 new colonies, three of which were previously identified but never confirmed. This discovery takes the global census to 61 colonies around the entire continent. 78)
- Although penguins are too small to show up in satellite images, giant stains on the ice from penguin droppings – known as guano – are easy to identify at the 10 m pixel resolution that the Copernicus Sentinel-2 mission offers.
- These brownish patches have allowed scientists to locate and track penguin populations across the entire continent.
- Peter Fretwell, lead author and geographer at BAS, comments, “This is an exciting discovery. The new satellite images of the Antarctica coastline have enabled us to find these new colonies. And whilst this is good news, the colonies are small and so only take the overall population count up by 5–10%, to just over half a million penguins or around 265 500 – 278 500 breeding pairs.”
- The results, thanks to satellite images from Copernicus Sentinel-2, are an important milestone for monitoring the impact of environmental change on the population of emperor penguins.
- The flightless birds are known to be particularly vulnerable to climate change, as warming ocean waters are melting the sea ice where they live and breed. Following the current projections of climate change, their habitat is likely to decline. The results from the study show that the majority of the newly found colonies are at the margins of the emperors’ breeding range – locations that could be lost as the climate continues to warm.

Figure 62: This map shows the locations of known, re-discovered and newly discovered penguin colonies in Antarctica (image credit: BAS/ESA)

Figure 63: A penguin colony near Ninnis Bank was spotted by the Copernicus Sentinel-2 mission on 26 August 2019. Although penguins are too small to show up in satellite images, giant stains on the ice from penguin droppings – known as guano – are easy to identify. These brownish patches have allowed scientists to locate and track penguin populations across the entire continent (image credit: ESA, the image contains modified Copernicus Sentinel data (2019), processed by ESA, CC BY-SA 3.0) IGO)

Figure 64: A penguin colony near Yule Bay was captured in this image by the Copernicus Sentinel-2 mission on 23 November 2016. Although penguins are too small to show up in satellite images, giant stains on the ice from penguin droppings – known as guano – are easy to identify. These brownish patches have allowed scientists to locate and track penguin populations across the entire continent (image credit: ESA, the image contains modified Copernicus Sentinel data (2016), processed by ESA)
- Philip Trathan, Head of Conservation Biology at BAS, has been studying penguins for the last three decades. He says, “Whilst it is good news that we’ve found these new colonies, the breeding sites are all in locations where recent model projections suggest emperors will decline. Birds in these sites are therefore probably the ‘canaries in the coalmine’ – we need to watch these sites carefully as climate change will affect this region.”
- The study found a number of colonies 180 km offshore, situated on sea ice that has formed around icebergs that had grounded in shallow water. These colonies are a surprising new finding in the behavior of this increasingly well-known species.
- Copernicus Sentinel-2 is a two-satellite mission designed specifically to deliver the wealth of data and imagery that are central to the European Commission’s Copernicus program. Satellites, such as the Sentinel-2 mission, provide us with a global coverage, revisiting the same region every few days. The data provide a good understanding of the health and behavior of our planet – and how it is continuously affected by climate change.

Figure 65: A penguin colony near Cape Gates was captured in this image by the Copernicus Sentinel-2 mission on 7 November 2016. Although penguins are too small to show up in satellite images, giant stains on the ice from penguin droppings – known as guano – are easy to identify. These brownish patches have allowed scientists to locate and track penguin populations across the entire continent (image credit: ESA, the images contains modified Copernicus Sentinel data (2016), processed by ESA, CC BY-SA 3.0 IGO)

Figure 66: Emperor penguins live in Antarctica, which is not only remote and inaccessible, but temperatures can drop to –50ºC. Studying penguin colonies is therefore extremely difficult. Nevertheless, over the last 10 years, scientists at the British Antarctic Survey (BAS) have been able to search for new emperor penguin colonies using satellite imagery (image credit: BAS)
• July 31, 2020: The Flinders mountains in South Australia are a classic example of a folded mountain range, which are formed when two or more of Earth’s tectonic plates collide – folding and pushing layers of land into mountain ranges. 79)
- The formation of the Flinders Range began to form around 800 million years ago, when an ancient sea deposited sediments into the Adelaide Geosyncline basin. Millions of years later, the sediments were folded into mountains, which have since eroded. However, the folded rocks remained and were uplifted to create the landscape as we see it today.
- The Flinders Ranges stretches for over 400 km across the Australian outback – from Port Pirie to Lake Callabonna. The first humans to inhabit the Flinders Ranges were the Adnyamathanha people, who have inhabited the range for tens of thousands of years.
- The area pictured here shows the Vulkathunha-Gammon Ranges National Park in the Northern Flinders Ranges. The rugged park’s main attractions include deep gorges, chasms and an impressive wilderness. Numerous creeks appear like veins across the entire image, while the straight, white lines visible in the bottom right are dirt roads.
- Slightly west of the image pictured here lies the Ediacara Hills, where some of the oldest fossil evidence of animal life was discovered.
- The flora of the Flinders Ranges are largely species who have adapted to a semi-arid environment, including sugar gum tree, cypress-pine and mallee. Since the eradication of dingoes in the area, the number of red kangaroos, western grey kangaroos and wallaroos in the mountains has increased.

Figure 67: The many colorful curves and folds of the Flinders Ranges – the largest mountain range in South Australia – are featured in this false-color image captured by the Copernicus Sentinel-2 mission. This image, also featured on the Earth from Space video program, was captured on 31 December 2019 by the Copernicus Sentinel-2 mission – a two-satellite mission to supply the coverage and data delivery needed for Europe’s Copernicus program. The image was processed by selecting spectral bands that can be used for classifying geological features (image credit: ESA, the image contains modified Copernicus Sentinel data (2019), processed by ESA, CC BY-SA 3.0 IGO)
• July 17, 2020: The Great Salt Lake is the largest salt water lake in the western hemisphere, and one of the most saline inland bodies of water in the world. The Great Salt Lake is the largest of the lake remnants of prehistoric freshwater Lake Bonneville, that once covered much of western Utah. 80)
- The lake is fed by the Bear, Weber and Jordan rivers which, together, deposit around 1 million tons of minerals in the lake each year. As the lake is endorheic, meaning without an outlet, the water evaporates which leads to a very high salt concentration. It greatly fluctuates in size, depending on the rates of evaporation and the flow of the rivers that feed it.
- The distinct color differences in the lake are caused by the Lucin Cutoff, an east-west causeway built to create a shorter route. The railroad line is visible as a sharp line cutting across the top part of the lake. This acts as a dam, preventing the waters to mix, leading to the north basin having a much higher salinity than the southern, freshwater side of the lake.
- As the lake’s main tributaries enter from the south, the water level of the southern section is slightly higher than that of the northern part. Several small islands, the largest of which are Antelope and Fremont, lie in the southern part of the lake.
- The lake’s varying shoreline consists of beaches, marshes and mudflats. The bright, turquoise colors visible on both sides of the lake are evaporation ponds, from which various salts are collected in commercial operations. Although it is commonly referred to as America’s Dead Sea, the lake is nevertheless an important habitat for millions of native and migratory birds. It is also home to several types of algae, brine shrimp and brine flies.
- The lake’s basin is defined by the foothills of the snow-capped Wasatch Range, to the east, and by the Great Salt Lake Desert, a remnant of the bed of Lake Bonneville, to the west. This part of the desert is known as the Bonneville Salt Flats and is used as an automobile raceway, as the flat and smooth salt beds make the area ideally suited for speed trials. Utah’s capital, Salt Lake City, is visible in the bottom right of the image.

Figure 68: Utah’s Great Salt Lake and its surroundings are featured in this false-color image captured by the Copernicus Sentinel-2 mission. This image, which was captured on 17 March 2019, is also featured on the Earth from Space video program (image credit: ESA, the image contains modified Copernicus Sentinel data (2019), processed by ESA, CC BY-SA 3.0 IGO)
- This image was processed in a way that included the near-infrared channel, which makes vegetation appear in red, while rocks and bare soil appear in brown. Copernicus Sentinel-2 is a two-satellite mission. Each satellite carries a high-resolution camera that images Earth’s surface in 13 spectral bands. The mission’s frequent revisits over the same area and high spatial resolution allow changes in inland water bodies to be closely monitored.
• July 3, 2020: A popular tourist and diving destination with white sandy beaches, the Republic of Maldives is located in the Indian Ocean, around 700 km southwest of Sri Lanka. This island nation consists of a chain of around 1200 small coral islands that are grouped into clusters of atolls – scattered across 90,000 km2 of ocean. 81)
- An atoll is a circular or oval-shaped reef structure with a lagoon in the center. These structures typically form around a volcanic island that has subsided while the coral grows upwards. The Maldives actually rests on top of an ancient volcanic mountain range.
- One of the world’s lowest-lying countries, more than 80% of the Maldives’ land is less than one meter above average sea level. This extremely low elevation makes the country, and its inhabitants, particularly vulnerable to sea-level rise.
- Satellite data has shown that the global ocean has risen, on average, 3 mm a year over the last 25 years. But more alarmingly, satellite data shows the rate of the rise has accelerated over the last few years, and has been rising at around 5 mm per year. Warming ocean waters, melting glaciers and diminishing ice sheets is making rising sea levels a real threat for low-lying islands such as the Maldives.
- The upcoming Copernicus Sentinel-6 Michael Freilich satellite, set to launch in November 2020, will map up to 95% of Earth’s oceans every 10 days. The satellite carries a new generation radar altimeter that will observe annual changes in mean sea level with millimeter precision, together with measurements of surface wind speed, sea state and geostrophic ocean currents. This new satellite will assume the role as a reference mission to provide critical data for the long-term record of sea-surface height measurements.
- These measurements are not only essential for monitoring our rising seas, but also for climate prediction, sustainable ocean-resource management, coastal management and environmental protection.
- ESA is jointly developing the mission with its partners NASA, the European Commission, EUMETSAT and NOAA, with support from CNES.

Figure 69: In this image, the Ari Atoll in the west of the archipelago is featured. The Ari Atoll is one of the largest atolls in the Maldives, and is around 90 km long and 30 km wide. The turquoise colors in the image depict clear, shallow waters which contrasts with the dark colored waters of the deep Indian Ocean. Several clouds can be seen at the bottom of the image. This image of Sentinel-2, which was captured on 12 April 2019, is also featured on the Earth from Space video program (image credit: ESA, the image contains modified Copernicus Sentinel data (2019), processed by ESA, CC BY-SA 3.0 IGO)
• June 30, 2020: On today's Asteroid Day, the Copernicus Sentinel-2 mission takes us over the Roter Kamm impact crater in Namibia. The circular shape of the crater rim can be seen in the left of the image, just below the center. 82)
- The Roter Kamm impact crater is located in the Tsau llKhaeb National Park, also known as the Sperrgebiet, a diamond mining area in the Namib Desert, in southwest Namibia. According to geologists, the crater was formed by a meteorite around the size of a large vehicle that collided with Earth approximately 5 million years ago.
- The crater has a diameter of 2.5 km and is around 130 m deep. It is clearly visible in the midst of the rust-red dunes, with its rims rising some 40 to 90 m above the surrounding plain. Its floors are covered by sand deposits at least 100 m thick.
- Meteorites and asteroids have influenced Earth’s development, as seen by the millions of impact craters scarring our world. Each year on 30 June, the worldwide UN-sanctioned Asteroid Day takes place to raise awareness about asteroids and what can be done to protect Earth from possible impact. The day falls on the anniversary of the Tunguska event that took place on 30 June 1908 in Siberia, the most harmful known asteroid related event in recent history.
- Over the last two decades, ESA has been performing detection and analysis of asteroids whose orbits bring them close to Earth, known as near-Earth objects (NEOs). There are an estimated 40,000,000 NEOs out there larger than 10 m – the threshold above which damage on the ground could happen.
- ESA is also developing the Hera mission, which will be the first to test the effectiveness of asteroid deflection, as it flies to the Didymos binary system that will soon be impacted by NASA’s DART. If an asteroid is detected that is on collision course with Earth, these missions mean we will be more prepared to act.

Figure 70: Image of the Roter Kamm impact crater in Namibia, acquired with Sentinel-2. The circular shape of the crater rim can be seen in the left of the image, just below the center (image credit: ESA, the image contains modified Copernicus Sentinel data (2020), processed by ESA, CC BY-SA 3.0 IGO)
• June 26, 2020: The Andes mountains, in southern Peru, are featured in this false-color image captured by the Copernicus Sentinel-2 mission. This image was processed in a way that makes vegetation appear blue, while irrigated vegetation and agriculture is visible in bright blue. 83)
- The Andes are considered the longest continental mountain range in the world. They extend around 7000 km through seven South American countries – from Venezuela in the north all the way to Chile in the south.
- The mountain range is the result of the Nazca and Antarctic tectonic plates moving under the South American plate in a geological process called subduction. Wind and water erosion are also a major factor for the shaping of the landscape.
- The small town of Puquio, with an elevation of over 3000 m, can be seen in the top right of the image – surrounded by vegetation. Directly to the left of Puquio, lies the Pampa Galeras National Reserve. This reserve protects the habitat of the threatened vicuña, a wild camelid which live in the high alpine areas of the Andes.
- The clouds in the bottom-left of the image are an example of marine stratocumulus. These low-lying clouds are caused by cooler waters in the Pacific Ocean being pulled up to the surface, cooling the air above it, and causing water vapor to condense into water droplets and, eventually, clouds. Marine stratocumulus clouds often develop off of Peru, with prevailing winds pushing the clouds inland. As the clouds are low, they are easily blocked by coastal mountains and hills, such as the Andes.
- Under the small cloud in the upper left of the image, lies the city of Nazca. Northwest of Nazca, the famous site of the Nazca lines can be found (not visible). The Nazca lines are a group of geoglyphs, or drawings, etched into the surface of the arid plain. The figures depict various plants, animals and many other shapes and extend over an area of around 500 km2.

Figure 71: In this image of Sentinel-2, captured on 16 June 2020, parts of the Ica, Ayacucho and Arequipa Regions in Peru are featured. Streams of water flowing from the high altitudes, and through the valleys, provide water for irrigation to the nearby agricultural fields. Some of these agricultural plots can be seen in bright blue in the image. This image is also featured on the Earth from Space video program (image credit: ESA, the image contains modified Copernicus Sentinel data (2020), processed by ESA, CC BY-SA 3.0 IGO)
• June 19, 2020: The Copernicus Sentinel-2 mission takes us over part of the Great Rift Valley, Kenya. This valley is part of the Gregory Rift, an eastern branch of the East African Rift, which is being caused by the separation of the Somali plate from the Nubian plate. Major tectonic and volcanic activity have shaped the distinctive landscape of the Great Rift Valley which runs through Kenya from north to south. 84)
- The dramatic landscape contains the Cherangani Hills and forests to the west, a chain of volcanoes, of which some are still active, escarpments and jewel-like lakes.
- Lake Baringo, one of the most northern of the Kenyan Rift Valley lakes, is visible at the top of the image. With a surface area of 130 km2 and an elevation of around 970 m, the lake has an average depth of around 5 m and it is one of the two freshwater lakes in the Rift Valley – the other being Lake Naivasha (not visible).
- This lake has no visible outlet; its waters are thought to seep into lavas at its northern end – where the rocky shore contrasts with the alluvial flat on its southern border.
- Baringo is dotted with several small islands. Its largest is visible in the center of the lake and is called Ol Kokwe (also known as the Meeting Place). It is an extinct volcano with several hot springs. A great variety of birds inhabit Lake Baringo, which is also home to hippopotamuses and crocodiles.
- South of Lake Baringo lies Lake Bogoria – a saline, alkaline lake. The long and narrow lake has an area of around 30 km2 and is around 10 m deep. Lake Bogoria provides refuge for the lesser flamingo, with a population of around 1 to 1.5 million, and also supports more than 300 waterbird species. The lake is a designated Ramsar site and is also part of the Lake Bogoria National Reserve.
- The lake is famous for geysers and hot springs along the bank of the lake – some of which can erupt up to 5 m high. The lake’s stable water level makes it highly important during times of drought.

Figure 72: This Sentinel-2 image of the Great Rift Valley in Kenya was captured on 13 March 2019, it is also featured on the Earth from Space video program (image credit: ESA, the image contains modified Copernicus Sentinel data (2019), processed by ESA, CC BY-SA 3.0 IGO)
• June 12, 2020: The Copernicus Sentinel-2 mission takes us over Barcelona – the second largest city in Spain. 85)
- On the northeast coast of the Iberian Peninsula, Barcelona occupies a low plateau along the Mediterranean coastal plain. The city and its red roofs contrast with the forested hills and the sea that surround it.
- The famous Avinguda Diagonal avenue can be seen in the right of the image. The road is one of Barcelona’s broadest avenues and cuts the city diagonally in two, hence its name. The circular Plaça de les Glòries Catalanes was meant to be the city center in the original urban plan, but nowadays is used largely as a roundabout.
- Dominating the left side of the image are the Garraf Massif mountains, their cliffs reaching the Mediterranean coast. Its highest point on the coastal side is La Morella – almost 600 m above sea level.
- The Llobregat River can be seen entering the image in the top left. The river rises in the eastern Pyrenees and flows southeast before emptying into the Mediterranean Sea. Before reaching the sea, the river forms a small delta, which used to provide a large extension of fertile land but is now largely urbanized. Barcelona-El Prat airport can be seen to the left of the river. Along the coast, the port of Barcelona, one of Europe’s top ten largest container ports, is visible.
- Barcelona is home to the Universitat Politècnica de Catalunya – the largest engineering university in Catalonia. In 2017, the university won ESA’s Small Satellite Challenge and the top prize at the Copernicus Masters competition with its Federated Satellite Systems (FSSCat) project. The FSSCat mission consists of two small CubeSat satellites, each about the size of a shoebox, and will use state-of-the-art dual microwave and multispectral optical sensors.
- Φ-sat-1 – an enhancement of FSSCat carried on one of the two CubeSats – is set to launch soon from Europe’s spaceport in Kourou. It will be the first experiment to demonstrate how artificial intelligence can be used for Earth observation. Φ-sat-1 will have the ability to filter out less than perfect images so that only usable data are returned to Earth. This will allow for the efficient handling of data so that users will have access to timely information – ultimately benefiting society at large.

Figure 73: This image of Sentinel-2, which was captured on 16 March 2017, is also featured on the Earth from Space video program (image credit: ESA, the image contains modified Copernicus Sentinel data (2017), processed by ESA, CC BY-SA 3.0 IGO)
- Φ-sat-1 will acquire an enormous number of images that will allow scientists to detect urban heat islands, monitor changes in vegetation and water quality, as well as carry out experiments on the role of evapotranspiration in climate change.
• June 9, 2020: The coronavirus pandemic has brought the tourism and travel industry to a near-standstill, with nationwide lockdowns significantly impacting the aviation and maritime industry worldwide. Satellite images, captured by the Copernicus Sentinel-2 mission, show parked aircraft and anchored vessels in times of COVID-19. 86)
- Global aviation is facing its battle to survive, with most flights grounded since March owing to travel restrictions in place to contain the coronavirus pandemic. According to aviation industry researcher Cirium, the number of passenger jets in service is the lowest it has been in 26 years.
- Managing large-scale storage poses a challenge for the industry, as airlines hunt for space on the ground for storage facilities. Taxiways, hangers and even runways at major airports around the world are being transformed into parking spaces for planes. These images captured by the Copernicus Sentinel-2 mission show the numerous parked planes on runways – even in remote airports such as Alice Springs in Australia.
- Airport storage facilities are sometimes referred to as ‘boneyards’ owing to airlines sending retired aircraft to the desert. These boneyards are often located in dry and arid places as the climate means planes can be preserved in excellent condition before returning to service or being reused.
- Teruel Airport in the Aragon province in Spain was built with this purpose in mind. According to a recent report in Reuters, the airport is hosting around 100 aircraft and the number of planes arriving per week to be parked in the airport has doubled since the start of the global pandemic.
- Another sector heavily affected by the pandemic is the cruise ship industry. Major cruise lines have suspended operations to mitigate the spread of COVID-19. Cruise ship operators around the world have struggled to find open ports to disembark, while some were forced to stay anchored at sea for an extended period of time.

Figure 74: Parked planes. These images show parked planes at various airports around the world during the coronavirus pandemic. The Copernicus Sentinel-2 images were captured in May 2020 (image credit: ESA, the image contains modified Copernicus Sentinel data (2020), processed by ESA, CC BY-SA 3.0 IGO)

Figure 75: Manila Bay, in the Philippines, has been transformed into a parking lot for cruise ships. In this animation, around 20 vessels can be seen anchored off the coast of Manila Bay. Captured by the Copernicus Sentinel-2 mission, this animation contains a sequence of images captured on 22 April, 2 May and 22 May 2020 (image credit: ESA, the image contains modified Copernicus Sentinel data (2020), processed by ESA, CC BY-SA 3.0 IGO)
- According to Reuters, the cruise ships have been asked to wait in the Manila Bay anchorage area with hundreds of seafarers remaining on board awaiting clearance in order to return home. The famous Diamond Princess and Ruby Princess vessels are said to be among the fleet.
- In order to learn more about space applications and the socio-economic impact of COVID-19, ESA and the European Commission recently unveiled the new ‘Rapid Action Coronavirus Earth observation’ dashboard, also known as RACE. The platform uses Earth observation satellite data to measure the impact of the coronavirus lockdown worldwide, and monitor post-lockdown recovery.
• June 5, 2020: A state of emergency has been declared after some 20,000 tons of diesel oil leaked into a river within the Arctic Circle. Images captured by the Copernicus Sentinel-2 mission show the extent of the spill. 87)
- According to media reports, the spillage occurred when a fuel tank at a power plant near Norilsk, operated by a subsidiary of Norilsk Nickel, collapsed on Friday 29 May. The leaked oil is reported to have drifted around 12 km from the accident site. In this animation, diesel oil is visible in the Ambarnaya River on both 31 May and 1 June – easily identifiable in crimson red.

Figure 76: The images captured by the Copernicus Sentinel-2 mission show the extent of the Arctic Circle oil spill (image credit: ESA, the image contains modified Copernicus Sentinel data (2020), processed by ESA, CC BY-SA 3.0 IGO)
- The Ambarnaya River flows into Lake Pyasino – a major body of water and source of the Pysaina River. Copernicus Sentinel-2 is a two-satellite mission to supply the coverage and data delivery needed for Europe’s Copernicus program. The mission’s frequent revisits over the same area and high spatial resolution allow changes in water bodies to be closely monitored.
• June 5, 2020: This image, captured by the Copernicus Sentinel-2 mission, takes us over part of Channel Country – a pastoral region located mostly in southwest Queensland, Australia. The name derives from the many intertwined rivers and channels that cut across the 155,000 km2 region during times of high water. 88)
- The landscape is mostly arid and includes flat alluvial terrain that is drained by the Georgina, Thomson, Diamantina and Barcoo rivers. This desert region usually becomes lush with greenery after periods of flooding, and the land is used for cattle grazing.
- In late March 2019, tropical cyclone Trevor hit northwest Queensland and produced heavy rain as it moved inland. According to the Australian Government Bureau of Meteorology, major flood levels were recorded across the Channel Country catchments.

Figure 77: This false-color image, captured shortly after the cyclone hit, on 5 April 2019, was processed in a way that included the near-infrared channel – which makes vegetation appear bright red. Mud and sediments in the waters of the Georgina and Diamantina Rivers and the other smaller channels can be seen in cyan. Desert, bare soil and rocks are visible in shades of green. This image is also featured on the Earth from Space video program (image credit: ESA, the image contains modified Copernicus Sentinel data (2019), processed by ESA, CC BY-SA 3.0 IGO)
- Flooded waters then usually empty into the Lake Eyre Basin (not visible), one of the driest areas in Australia.
- In the bottom left of the image, the Lake Machattie area is visible. Covering an area of around 900 km2, the area comprises three freshwater lakes: Lake Machattie, Lake Mipia, and Lake Koolivoo, and two nearby floodplains. The region is a designated Important Bird and Biodiversity Area by Birdlife International as it has supported over 300,000 water birds.
- The 5 June marks World Environment Day, which aims to raise awareness and take action on urgent environmental issues. World Environment Day 2020 calls for urgent action to protect biodiversity.
• May 29, 2020: The Copernicus Sentinel-2 mission takes us over part of Abu Dhabi – one of the seven emirates that constitute the United Arab Emirates (UAE). 89)
- Covering an area of approximately 67,000 km2, the Emirate of Abu Dhabi is the largest emirate in the UAE – accounting for around 87% of the total land area of the federation. Abu Dhabi has around 200 islands lying along its 700 km long coastline.

Figure 78: The city of Abu Dhabi, after which the emirate is named, is located on an island in the Persian Gulf and can be seen slightly below the center of the image. Abu Dhabi is the capital and the second-most populous city of the UAE – after Dubai. The city is directly connected to the mainland by three bridges: Maqta, Mussafah and Sheikh Zayed. This image, captured on 27 January 2019, is also featured on the Earth from Space video program (image credit: ESA, the image contains modified Copernicus Sentinel data (2019), processed by ESA, CC BY-SA 3.0 IGO)
- Just east of the city lies the Mangrove National Park, visible as a dark green patch of land. The protected area is around 20 km2 and includes mangrove forests, salt marshes, mudflats and is home to more than 60 bird species.
- The waters surrounding Abu Dhabi are said to hold the world’s largest population of Indo-Pacific humpback dolphins. The lighter aqua colors are shallow waters, which contrast with the dark colored waters of the Gulf.
- The iconic red roof of Ferrari World can be seen in the center-right of the image. The Ferrari-themed park is located on Yas Island and is said to be the world’s largest indoor theme park. Abu Dhabi International Airport is visible southeast of the park.
• May 28, 2020: River ice jams are a prime source of flood risk in cold regions. In April 2020, an ice jam developed on the Athabasca River in Canada – leading to the flooding of Fort McMurray. Satellite data provided by the European Union’s Copernicus Sentinels, are lending a hand to monitor river ice conditions. 90)
- Ice jams can occur at any time in winter, but the ones that take place during spring’s river ice breakup tend to be the most common and destructive. The flooding in Fort McMurray displaced some 13,000 people and damaged 1200 properties.
- The independent Dutch institute for applied research, Deltares, are working together with the River Ice Team of Alberta Environment and Parks and, with scientific support from Natural Resources Canada, to set-up operational access to near real-time satellite data, and develop and implement methods to detect and classify river ice.
- Read full story: Copernicus Sentinels help classify river ice.

Figure 79: This false-color image was captured by the Copernicus Sentinel-2 mission and shows the extent of the flooding. This composite image contains images acquired on 28 April (majority of image, bottom right) and 29 April 2020 (top left). White lines in the image indicate the normal extent of the river channel (image credit: ESA, the image contains modified Copernicus Sentinel data (2020), processed by Deltares)
• May 22, 2020: The Copernicus Sentinel-2 mission takes us over part of Chile's Atacama Desert, which is bound on the west by the Pacific and on the east by the Andes. The Atacama is considered one of the driest places on Earth – there are some parts of the desert where rainfall has never been recorded. 91)

Figure 80: In this image, captured on 26 June 2019, a specific area in the Tarapacá Region, in northern Chile, is featured – where some of the largest caliche deposits can be found. It is here where nitrates, lithium, potassium and iodine are mined. This image is also featured on the Earth from Space video program (image credit: ESA, the image contains modified Copernicus Sentinel data (2019), processed by ESA, CC BY-SA 3.0 IGO)
- Iodine, for example, is extracted in a process called heap leaching – which is widely used in modern large-scale mining operations. Leach piles are visible as rectangular shapes dotted around the image, although the exact reason for the different shades of color is uncertain. Some leach piles could appear lighter or darker owing to the varying water content or soil type concentration.
- The geometric shapes in the right are large evaporation ponds. Brine is pumped to the surface through a network of wells into the shallow ponds. The dry and windy climate enhances the evaporation of the water and leaves concentrated salts behind for the extraction of lithium – which is used in the manufacturing of batteries.
- The bright, turquoise colors of the evaporation ponds are in stark contrast with the surrounding desert landscape – making them easily identifiable from space. Distinctive black lines visible in the image are roads that connect to the various construction sites.
- Copernicus Sentinel-2 is a two-satellite mission to supply the coverage and data delivery needed for Europe’s Copernicus program. This false-color image was processed by selecting spectral bands that can be used for classifying geological features.
• May 15, 2020: The Copernicus Sentinel-2 mission takes us over San Francisco Bay in the US state of California. 92)
- San Francisco Bay, almost 100 km in length (Figure 81), is a shallow estuary surrounded by the San Francisco Bay Area – an extensive metropolitan region that is dominated by large cities such as San Francisco, Oakland and San Jose. The densely populated urban areas around the bay contrast strongly with the surrounding green forest and park areas.
- The Golden Gate Bridge, around 2.7 km long, is visible crossing the opening of the bay into the Pacific Ocean between Marin County and the city of San Francisco – which can be seen at the tip of the southern peninsula in the center of the image. Treasure, Angel and Alcatraz islands can be seen sticking out of the waters of the bay, with several bridges connecting its east and west shores. Several boats are also visible.
- The bright green and yellow colors in the bottom right of the image are salt ponds and are part of the Don Edwards National Wildlife Refuge. Covering an area of around 120 km2, the refuge contains salt marsh, mudflat and vernal pool habitats for millions of migratory birds and endangered species.

Figure 81: In the upper right of the image, the delta of the Sacramento and San Joaquin rivers is visible – with the brown, sediment-filled water flowing down into San Pablo Bay. Here, the murky waters mix before flowing into the larger bay area, which is connected to the Pacific Ocean via the Golden Gate strait. A large sediment plume can be seen travelling westward into the Pacific in the left of the image. This image, captured on 25 January 2019, is also featured on the Earth from Space video program (image credit: ESA, the image contains modified Copernicus Sentinel data (2019), processed by ESA, CC BY-SA 3.0 IGO)
• May 01, 2020: This week's image of the Earth from Space Program explores the Southern Ukraine. Owing to Ukraine’s climate and arable land, agriculture plays a large role in the country’s economy. In this image, captured on 26 June 2019, a patchwork of agricultural fields dominate the landscape. Ukraine’s main grain crops are winter wheat, spring barley and corn. 93)

Figure 82: Southern Ukraine is featured in this false-color image captured by the Copernicus Sentinel-2 mission. This image was processed in a way that included the near-infrared channel, which makes vegetation appear bright red. This image is also featured on the Earth from Space video program (image credit: ESA, the image contains modified Copernicus Sentinel data (2019), processed by ESA, CC BY-SA 3.0 IGO)
- Circular shapes in the image are an example of center-pivot irrigation systems, where equipment rotates around a central pivot and crops are watered with sprinklers.
- The bright red contrasts with the black waters of the Kakhovka Reservoir on the Dnieper River, visible at the top of the image. Canals are visible as thin, black lines cutting through the agricultural fields, and are mostly used for water supply and irrigation of the surrounding farmlands.
- In the far left of the image, the oval-shaped Oleshky Sands is visible. Covering an area of around 160 km2, this large expanse of sand is considered a small desert in the Ukraine. The grassy plains that used to cover the area are said to have died off hundreds of years ago owing to sheep farming – initiating the area’s desertification.
- In the bottom-right of the image, a colorful network of salty lagoons lie along the northern border of the Crimean Peninsula. These shallow, marshy inlets are known as Syvash (also Sivash or Sivaš). During summer months, the warmer marsh waters leave unpleasant odors – earning the region the nicknames ‘Putrid Sea’ and ‘Rotten Sea.’
• April 24, 2020: The Copernicus Sentinel-2 mission takes us over part of the Namib Desert in western Namibia. At 55 million years old, Namib is considered the oldest desert on Earth. 94)
- The Namib-Naukluft National Park's main attraction is Sossusvlei – a large salt and clay pan visible in the center of the image (Figure 83). The bright white floors of the pan contrasts with the rust-red dunes that surround it.
- Sossusvlei acts as an endorheic basin for the Tsauchab River – an ephemeral river flowing from the east. Owing to the dry conditions in the Namib Desert, the river rarely flows this far and the pan usually remains dry most years. In the past, water from the Tsauchab has reached the Atlantic coast a further 60 km away.
- These dunes contrast with the saffron-colored dunes visible in the Namib Sand Sea, just south of Soussusvlei. The sand sea consists of two dune seas, one on top of another. The foundation of the ancient sand sea has existed for at least 21 million years, while the younger sand on top has existed for around 5 million years. The dunes here are formed by the transportation of materials from thousands of kilometers away, carried by river, ocean current and wind.
- The Namib Sand Sea is the only coastal desert in the world to contain large dune fields influenced by fog – the primary source of water for the Namib Sand Sea. Haze is visible in the bottom left of the image, the last leftovers of fog coming from the Atlantic Ocean.

Figure 83: In this image, captured on 27 October 2019, a large portion of the Namib-Naukluft National Park is visible. The park covers an area of almost 50,000 km2 and encompasses part of the Namib Desert and the Naukluft Mountains to the east. Straight, white lines visible in the right of the image are roads that connect the Namib-Naukluft National Park with other parts of Namibia. This image is featured on the Earth from Space video program (image credit: ESA, the image contains modified Copernicus Sentinel data (2019), processed by ESA, CC BY-SA 3.0 IGO)
• April 23, 2020: While the COVID-19 virus pandemic is forcing everybody to stay at home, we bring you these beautiful views from space of the Dutch tulip fields coming into bloom. Captured by the Copernicus Sentinel-2 mission on 5 April, 10 April, 15 April and 20 April 2020, this sequence of images shows how the fields change from browns and greens to an array of vibrant colors. Lasting just a few weeks, the beauty of these colors normally attracts millions of visitors from all over the world. Sadly, this is not the case this year, as the COVID-19 crisis means that people cannot travel and even locals are actively discouraged from visiting the fields. 95)

Figure 84: The image features the area around the small town Lisse, home to the world-famous showcase for floriculture the Keukenhof flower park. The area, which lies close to the coast in the Dutch province of South Holland, is famed for producing bulbs which are exported all over the globe. The fields are only in bloom for a few short weeks. When the tulips reach full bloom, the farmers quickly remove their colorful heads to divert the flowers' energy back to the bulbs to help keep them strong (image credit: ESA, the image contains modified Copernicus Sentinel data (2020), processed by ESA, CC BY-SA 3.0 IGO)
- Keukenhof will not open this year: On 23 March, the Dutch government tightened up the measures to prevent the spread of the corona virus. All meetings and events will be canceled until June 1, even with less than 100 visitors. This means that Keukenhof Flower Exhibition cannot open in 2020.
• April 17, 2020: The Copernicus Sentinel-2 mission takes us over Montevideo – the capital and largest city of Uruguay. 96)
- With an area of around 175,000 km2, Uruguay is geographically the second smallest nation in South America. Around half of the country’s total population lives in the Montevideo metropolitan area – visible as a grey, gridded expanse in this week’s image.
- Montevideo is the southernmost capital city in the Americas and is known for its beaches – visible east of the city. The Rambla of Montevideo, the city’s famous promenade, stretches for 27 km along the coast – making it one of the longest esplanades in the world.
- Montevideo lies on the northern shore of the River Plate, known as Río de la Plata in Spanish, an estuary formed by the confluence of the Paraná and Uruguay rivers. The Santa Lucia River, visible west of Montevideo, forms the natural border between Montevideo and the San José Department. The Santa Lucía River flows for around 230 km before forming a small delta and emptying into the River Plate. It is here that the river’s silt-laden waters, visible in dark brown, mix with the murky colored waters of the River Plate.
- Water from these two rivers then flows eastwards and mixes with the clearer, turquoise-colored waters of the South Atlantic Ocean – visible in the far-right of the image.

Figure 85: This image was captured on 18 October 2019 by the Copernicus Sentinel-2 mission – a two-satellite mission to supply the coverage and data delivery needed for Europe’s Copernicus program. The mission’s frequent revisits over the same area and high spatial resolution allow changes in land cover and water bodies to be closely monitored. This image is also featured on the Earth from Space video program (image credit: ESA, the image contains modified Copernicus Sentinel data (2019), processed by ESA, CC BY-SA 3.0 IGO)
• April 16, 2020: With an outbreak of wildfires recently threatening the closed Chernobyl nuclear power plant in the Ukraine, the Copernicus Emergency Mapping Service has been activated and the Copernicus Sentinel-2 satellite mission has imaged the fires and smoke, and mapped the resulting area of burned ground. 97)
- Thankfully, heavy rain yesterday means that most of the flames have now been extinguished. Nevertheless, the Ukrainian authorities also reported yesterday that there was still more than 500 firefighters, 124 fire engines and several helicopters still working to contain the smouldering.
- In 1986, the nuclear site suffered a disastrous meltdown that spread radioactive fallout across Europe. The concerns were that the fires could reach the defunct nuclear reactor and a storage site for radioactive waste, and that there could be a risk of exposure to increased radiation from the burning of contaminated forest and soil.
- Fires around Chernobyl are a seasonal phenomenon, but have been worse than normal this year owing to a mild winter and spring that has left the forest floor dry.
- Satellites are key to keeping an eye on vulnerable regions such as this. Each of the two satellites in Copernicus Sentinel-2 constellation is equipped with a wide-swath multispectral sensor that can image in 13 spectral bands.

Figure 86: An outbreak of wildfires recently threatening the abandoned Chernobyl nuclear power plant in Ukraine. The animation above uses images from Copernicus Sentinel-2 to show the situation prior to the fires on 7 April, and then on 12 April. The image from 12 April is from one acquisition, but has been processed to show thermal anomalies, smoke from the fires and then the burned area through the smoke (image credit: ESA, the image contains Copernicus Sentinel data (2020), processed by ESA, CC BY-SA 3.0 IGO)
- The mission is being used as part of an activation of the Copernicus Emergency Management Service to provide maps of the burned area to help authorities respond to the consequences of this recent fire. The image on the right is an example of a map being provided through the service.

Figure 87: This map has been generated by the Copernicus Emergency Management Service using an image acquired by Copernicus Sentinel-2 on 12 April 2020. The map shows the burned area around Chernobyl in the Ukraine following an outbreak of wildfires. The Emergency Management Service was activated on 14 April 2020 to help in the response to the fires (image credit: ESA, Copernicus Emergency Management Service)
- Using satellite data, the service provides information for emergency response for different types of disasters, including meteorological and geophysical hazards, deliberate and accidental disasters, humanitarian disasters, and for prevention, preparedness, response and recovery activities.
- The animation featured in Figures 86 and 87 uses images from Copernicus Sentinel-2 to show the situation prior to the fires on 7 April, and then on 12 April. The image from 12 April is from one acquisition, but has been processed to show the smoke from the fires and then the burned area through the smoke.

Figure 88: This extract of a burned area mapping product was generated by the CIMA Foundation and Fadeout using the WASDI processing environment. It is based on images acquired by Copernicus Sentinel-2 on 26 March and 10 April 2020. It shows the burned area around Chernobyl in the Ukraine on 10 April following an outbreak of wildfires. CIMA Foundation is leading an ESA project called eDRIFT that is looking at Disaster Risk Financing using Cloud processing of Copernicus Sentinel imagery (image credit: ESA, the image contains Copernicus Sentinel data (2020), processed by CIMA Foundation and Fadeout srl)
• April 14, 2020: Italy’s efforts to limit the spread of the coronavirus disease has led to a decrease of boat traffic in Venice’s famous waterways – as captured by the Copernicus Sentinel-2 mission. 98)
- The Italian government imposed a nationwide lockdown on 9 March 2020, drastically reducing the movement of Venice’s boats including the ‘vaporetti,’ or water buses, as well as cruise ships.
- The Grand Canal and the Giudecca Channel appear almost empty compared to last year, and traffic from Venice to the island of Murano appears to be non-existent. Two large cruise ships can be seen in the U-shaped Port of Venice in 2019, west of the city, while this year the port appears empty.

Figure 89: These images show one of the effects of the locked-down city of Venice, in northern Italy. The top image, captured 13 April 2020, shows a distinct lack of boat traffic compared to the image from 19 April 2019 (image credit: ESA, the images contain modified Copernicus Sentinel data (2019-20), processed by ESA, CC BY-SA 3.0 IGO)
- According to the Italian news agency, ANSA, the streets and canals of Venice remained almost empty over Easter – with only police officers patrolling the streets and waterways.
- Meanwhile, the lockdown has led to a sharp decline in air pollution across Europe – particularly in Rome and the Po Valley in northern Italy.
• April 10, 2020: In this week's edition of the Earth from Space program, Copernicus Sentinel-2 takes us over an area in the Wheatbelt region of Western Australia. 99)
- The term ‘wheat belt’ refers to inland agricultural areas in eastern and southern Australia named for their production of wheat – which was the main agricultural product in the early history of Australia’s development. Wheatbelt areas are usually arid, making agriculture largely reliant on rainfall and irrigation.
- The Wheatbelt is one of the nine regions of Western Australia and lies in the southwest section of the state. Covering an area of around 160,000 km2, the region only has an estimated population of around 75,000 residents.
- This image shows a part of the region which is very arid and is used mainly for agricultural production. The area is a major producer of wheat, barley and wool. The area is also used for the livestock production and the pastoral sheep farming, as well as horticulture.
- Fields have a distinctive appearance in this week’s image, creating a colorful patchwork of geometric shapes. This composite image of Figure 90 was created by combining three separate images from the near-infrared channel from the Copernicus Sentinel-2 mission.

Figure 90: The first image, from 9 May 2019, is visible in red; the second from 6 September 2019, can be seen in green; and the third from January 2020 can be seen in blue. All other colors visible in the image are different mixtures of red, green and blue, and vary according to their stage of growth over the nine-month period. This image is also featured on the Earth from Space video program (image credit: ESA, the image contains modified Copernicus Sentinel data (2019), processed by ESA, CC BY-SA 3.0 IGO)
- According to reports from the Department of Primary Industries and Regional Development, Western Australia’s climate has changed over recent decades, with significant reductions in growing-season rainfall. Climate variability and changing weather patterns strongly affect agriculture – increasing production risk for crops and pastures.
- Owing to their unique perspective from space, Earth observation satellites are key in mapping and monitoring croplands. The Copernicus Sentinel-2 mission is specifically designed to provide images that can be used to distinguish between different crop types as well as data on numerous plant indices, such as leaf area index, leaf chlorophyll content and leaf water content – all of which are essential to accurately monitor plant growth.
• April 03, 2020: The Copernicus Sentinel-2 mission takes us over Finistère – a French department in the west of Brittany. 100)
- Brittany is an important cultural region in the northwest of France. Previously a kingdom, then a duchy, Brittany was united with France in 1532. Today, Brittany is divided into four departments: Ille-et-Vilaine in the east, Morbihan in the south, Côtes d'Armor in the north and Finistère in the west. Brittany has over 1000 km of coastline – with a wide range of beaches and rocky, coastal scenery making it a popular holiday destination.

Figure 91: Fields blanket the French countryside and dominate this image captured on 27 September 2018 with Sentinel-2. Brittany is one of France’s leading vegetable growing regions known for its artichokes, cauliflowers, carrots and potatoes. In fact, France is one of the EU’s leading agricultural countries and is home to around a third of all agricultural land in the EU. This image is also featured on the Earth from Space video program (image credit: ESA, the image contains modified Copernicus Sentinel data (2018), processed by ESA, CC BY-SA 3.0 IGO)
- The city of Brest can be seen in the left of the image, lying along the sheltered bay close to the western tip of the peninsula. With a population of around 150,000, Brest is the largest city in the Finistère department. The port town played an important role in French history as it was a key naval base during World War II.
- Just west of Brest lies Pointe de Corsen, otherwise known as the westernmost point of continental France. The name Finistère derives from the Latin ‘Finis Terræ’ – meaning ‘end of the earth’.
- Ushant, or Ouessant in French, and the Iroise Islands lie around 30 km from the coast of France and can be seen in the left of the image.
- The Copernicus Sentinel-2 mission is designed to provide images that can be used to distinguish between different crop types as well as data on numerous plant indices, such as leaf area, leaf chlorophyll and leaf water – all essential to monitor plant growth accurately.
• March 20, 2020: Earth’s land is covered by a range of different types of vegetation, from forest and marsh to crops and bodies of water, as well as the artificial surfaces that are an increasingly common feature of our landscape. 101)
- Mapping land cover is not only essential for monitoring change, but it also underpins numerous practical applications. However, generating these maps entails handling huge amounts of satellite data and some technical expertise. Thanks to the Copernicus Sentinel-2 mission and new cloud-computing resources, fully automated land-cover maps in 10 m resolution are on the horizon.
- Natural processes, climate change and the way we use land to feed, shelter and support a growing population means that Earth’s land cover is in a continual state of change.
- Information on land cover is important at many levels – at local, regional, national and global scales, and over different timescales.
- Up-to-date maps are a basic source of information to track the impact that human activity, natural processes and climate change have on land cover. These maps are critical for making informed policy, development and resource management decisions, and for disciplines such as agriculture, forestry, water management, urban planning, environmental protection and crisis management.
- While the Copernicus Sentinel-2 mission delivers ideal images to map land cover, producing maps means that huge amounts of time-series data have to be processed. To make this possible, the ESA-funded Sentinel-2 for Science Land Cover project explored novel ways of capitalizing on the latest cloud-computing technologies and machine learning to automate mapping. While still in the experimental stage, the results demonstrate that fully-automated mapping is just around the corner. For example, Europe’s land-cover has been mapped showing 13 land cover classifications.
- Orbiting almost 800 km above, the two-satellite Copernicus Sentinel-2 mission is on hand to map land cover in 10 m resolution.

Figure 92: Europe land-cover mapped in 10 m resolution of 2017 (image credit: ESA, the image contains modified Copernicus Sentinel data (2017), processed by CBK PANsí mi)
- Each identical satellite carries a multispectral imager that can distinguish between different classes of cover such as forest, cultivated areas, grassland, water and artificial surfaces like roads and buildings. The mission can also be used to determine plant indices such as the amount of chlorophyll and water in leaves so that changes in plant health and growth can be monitored.

Figure 93: Austria land cover map (image credit: ESA, the image contains modified Copernicus Sentinel data (2017), processed by CBK PANsí mi)
- Through this experiment, different methodologies were explored and tested over different areas of the world, including the full European region.
- The scientists used dedicated software developed by the Space Research Center of the Polish Academy of Sciences, CBK PAN, to process the satellite images and auxiliary data.
- Stanislaw Lewinski, from CBK PAN, said, “Indeed mapping land cover is a real technical undertaking, but thanks to funding from ESA we have developed a classification methodology that is mainly automated to make land-cover mapping easier.

Figure 94: Poland land cover map (image credit: ESA, the image contains modified Copernicus Sentinel data (2017), processed by CBK PANsí mi)
- “Our system is based on Copernicus Sentinel-2 imagery where each image tile has been classified separately using a set of images from different times, and we chose a pixel-based approach to maintain the mission’s 10 m resolution. Importantly, it also involved many tests in selected areas across Europe. The final maps have been produced on a platform called CREODIAS with the algorithms and software that we developed.”
- CREODIAS is a large-scale computing and data storage platform that enables processing and publication of results of large-scale data analysis activities. The result is a map of Europe at 10 m resolution displaying 13 land-cover classes.
- ESA’s Espen Volden noted, “While we are still in the experimental stage and some land-cover classes don’t reach an accuracy that can be exploited directly and there are some other artefacts, the results are very promising. We demonstrate that fully-automated mapping is on the horizon, opening the way to much more frequently updated land-cover information than has been possible so far.”

Figure 95: Italy’s land classified map (image credit: ESA, the image contains modified Copernicus Sentinel data (2017), processed by CBK PANsí mi)
Viewing and download
- The map of Europe at 10 m resolution displaying 13 land-cover classes can be viewed in full resolution on the CREOSIAS EO Browser (select S2GLC and click search), or accessed as a WMS layer for expert use.
- All classified Sentinel-2 tiles can be downloaded from the CREODIAS finder.
- Download the full-resolution mosaic (see data access), or as reduced-resolution country maps of 35 European countries.

Figure 96: Greece land cover map (image credit: ESA, the image contains modified Copernicus Sentinel data (2017), processed by CBK PANsí mi)
• March 20, 2020: The Copernicus Sentinel-2 mission takes us over Kuwait in the Middle East. With a total area of around 17,800 km2, Kuwait is considered one of the smallest countries in the world. At its most distant points, it is around 200 km north to south and 170 km east to west. 102)
- Situated in the northeast of the Arabian Peninsula, Kuwait shares its borders with Iraq to the north and Saudi Arabia to the south. Kuwait is generally low lying, with the highest point being only 300 m above sea level.

Figure 97: The flat, sandy Arabian Desert covers the majority of Kuwait and appears as a vast expanse of light sand-colored terrain in this image, captured on 25 July 2019. During the dry season, between April and September, the heat in the desert can be severe with daytime temperatures reaching 45ºC and, on occasion, over 50ºC. This image is also featured on the Earth from Space video program (image credit: ESA, the image contains modified Copernicus Sentinel data (2019), processed by ESA, CC BY-SA 3.0 IGO)
- Kuwait City, visible jutting out into Kuwait Bay, holds most of the country’s population – making Kuwait one of the most urbanized countries in the world.
- The various colors of Kuwait Bay come from a combination of wind and the amount of sunlight reflected off the waters. The Sheikh Jaber Al-Ahmad Al-Sabah Causeway can be seen cutting across the bay. The bridge is 36 km long – making it the fourth largest bridge in the world.
- Al-Jahra lies around 50 km west of Kuwait City and is visible as a small, green oasis on the west side of Kuwait Bay. It is the center of the country’s principal agricultural region – producing primarily fruits and vegetables. The circular shapes to the right of Al-Jahra are an example of the pivot irrigation or center-pivot irrigation method, where equipment rotates around a central pivot and crops are watered with sprinklers.
- Just south of Kuwait City lies the Great Burgan oil field – considered the second largest oil field in the world. The Great Burgan comprises three smaller fields: Burgan, Al-Maqwa and Al-Ahmadi. The oil fields can be identified an extensive network of interlocking roads which connect the individual wellheads.
- Satellites, such as Copernicus Sentinel-2, allow us to capture images such as these from space, but also allows us to monitor changing places on Earth. Flying 800 km above, satellites take the pulse of our planet by systematically imaging and measuring changes taking place, which is particularly important in regions that are otherwise difficult to access.
• March 13, 2020: The Copernicus Sentinel-2 mission takes us over Victoria Falls – one of the world’s greatest natural wonders. Victoria Falls, known locally as Mosi-oa Tunya or ‘the smoke that thunders,’ lies along the course of the Zambezi River, on the border between Zambia to the north and Zimbabwe to the south. The Zambezi River flows for around 3500 km from its source on the Central African Plateau and empties into the Indian Ocean. 103)

Figure 98: In this image, captured on 22 February 2019, the river cuts from left to right in the image before plunging over Victoria Falls – visible as a white line in the image. While it is neither the highest nor the widest waterfall in the world, Victoria Falls has a width of around 1700 m and a height of over 100 m which classifies it as the world’s largest sheet of falling water. This image is also featured on the Earth from Space video program (image credit: ESA, the image contains modified Copernicus Sentinel data (2019), processed by ESA)
- The spray from the falls normally rises to a height of over 400 m and is sometimes visible from up to 40 km away. The water from the Zambezi River then continues and enters a narrow, zigzagging series of gorges, visible in the bottom right of the image.
- Despite recent reports of Victoria Falls drying up, the Zambezi River is subject to large seasonal fluctuations – with water levels rising and dropping dramatically throughout the year. According to the Zambezi River Authority, the lowest recorded water flows recorded were during the 1995—96 season, which had an annual mean flow of around 390 m3/s, compared to the long-term mean annual flow of around 1100 m3/s.
- The town of Victoria Falls, in Zimbabwe, can be seen west of the falls, while the town of Livingstone – named after the famous Scottish explorer – is visible just north of the falls, in Zambia. The Harry Mwanga Nkumbula airport can be seen west of the town.
- The circular shapes in the image are an example of an irrigation method called pivot irrigation or center-pivot irrigation, where equipment rotates around a central pivot and crops are watered with sprinklers.
• March 6, 2020: Thousands of fires broke out in the Amazon last year – sparking an international media frenzy. A detailed analysis, using data from the European Space Agency’s Climate Change Initiative, indicates that while there was a small increase of fires in 2019 compared to 2018, fires in Brazil were similar to the average annual number of fires detected over the past 18 years. 104)
- While forest fires are common in the Amazon region, they vary considerably from year-to-year driven by changes in climate, as well as variations in deforestation and forest degradation.
- Attention on fires last year sparked an international demand for up-to-date information on active fires – particularly in Brazil. However, these numbers were never compared to the number of fires over a longer period of time.
- Detailed in a recent paper published in Remote Sensing, scientists using data from ESA’s Fire CCI project, analyzed burned areas in South America in both 2018 and 2019 – and compared the data to the 2001-18 yearly average. 105)
- According to the report, the total burned area in South America was around 70% more in 2019 compared to the same period of 2018, however only slightly more than the yearly average over the past 17 years.
- These results are particularly interesting for Brazil, which only saw a 1.7% increase of burned area in 2019 compared to the long-term average.
- Bolivia, on the other hand, saw a 51.4% increase of burned areas in 2019, compared to the yearly average.
- Emilio Chuvieco, science leader of the Fire CCI project, comments, “Studies such as these are important to quantify and monitor fire activities in places such as the Amazon. However, they indicate the importance of long-term data series and studies using higher resolution sensors, such as the Copernicus Sentinel-2 multispectral instrument, to detect fires.”

Figure 99: This map shows the increase or decrease of the total burned area in 2019 compared to the 2001-2018 average (image credit: Lizundia-Loiola, J., Pettinari, M.L., & Chuvieco, E. (2020). Temporal Anomalies in Burned Area)
- Earth observing satellites can be used to detect and monitor fires over frequently affected areas. These burned area estimates are from ESA’s Fire Climate Change Initiative project, which produces long-term datasets of burned area information from satellites, as part of the ESA Climate Change Initiative.
- The data is of use for those interested in historical burned patterns, fire management and emissions analysis and climate change research, by providing a consistent burned area time series.
- Josef Aschbacher, ESA’s Director of Earth Observation Programs, says, “These observations show the challenge we are facing - the processes on Earth and in the forests are very dynamic. The unusual increase of fire activity in 2019 demonstrates that satellite data is essential to get a clear and independent picture in order to also understand long-term trends.”

Figure 100: This graph shows the country distribution of burned areas for 2018, 2019 as well as the average for the 2001-2018 period. Brazil has a 1.7% increase of burned area in 2019 compared to the long-term average [image credit: Lizundia-Loiola, J., Pettinari, M. L., & Chuvieco, E. (2020)]
- Tropical forests are home to around half of the world’s biodiversity, and are considered a fundamental part of Earth’s ecosystem. Quantifying fires in forests is important for the ongoing study of climate, as they have a significant impact on atmospheric emissions – with biomass burning contributing to the global budgets of greenhouse gases.
• March 4, 2020: A powerful winter storm, with lake-effect snow, brought blizzard conditions to New York last week and buried the area surrounding the Great Lakes under a blanket of snow. Days of strong winds, with speeds of over 90 km/h, blew lake water ashore, encasing several homes in ice. 106)
- Lake-effect snow is a weather phenomenon that occurs when cold, dry air picks up moisture by passing over relatively warmer lake waters. The air rises and forms clouds, generating what is known as lake-effect snow. This lake-effect snow is common in the Great Lakes area – where cold air, usually from Canada, moves in.

Figure 101: This image, captured by the Copernicus Sentinel-2 mission on 29 February, shows the extent of the snow in the area surrounding Lake St. Clair, Lake Erie and Lake Huron. A layer of ice can be seen over both Lake St. Clair and Lake Erie (image credit: ESA, the image contains modified Copernicus Sentinel data (2020), processed by ESA, CC BY-SA 3.0 IGO)
• February 28, 2020: Andros Island, the largest island of the Bahamas, is featured in this false-color image captured by the Copernicus Sentinel-2 mission. This image was processed in a way that included the near-infrared channel, which highlights the island’s vegetation in bright red. 107)
- Andros is around 160 km from north to south, and 70 km from east to west at its widest point. The island is largely unpopulated and has undeveloped stretches of land. Even though it is considered a single island, Andros is an archipelago made up of hundreds of small islets and cays connected by estuaries and swamplands together with three major islands: North Andros, Mangrove Cay and South Andros.
- The island’s west coast features many bays, channels and inlets. The turquoise colors of the ocean show shallow waters, whereas the dark blue colors are the deep ocean.
- The West Side National Park covers the west part of Andros and includes its pristine coastal wetlands. The 6000 km2 park is the largest protected area in the region,and is a prime habitat for bonefish and an important feeding area for the endangered West Indian flamingo.

Figure 102: This image was acquired with Sentinel-2 on 5 September 2019, just days after the mighty Hurricane Dorian passed over the Bahamas and unleashed a siege of destruction. Dorian is reported to be one of the most powerful Atlantic hurricanes on record – with storm surges, wind and rain that claimed many lives, destroyed homes and left thousands of people homeless. This image is also featured on the Earth from Space video program (image credit: ESA, the image contains modified Copernicus Sentinel data (2019), processed by ESA, CC BY-SA 3.0 IGO)
- Compared to acquisitions captured in the days leading up to Hurricane Dorian making landfall, the area in the top-left of the image appears to be more flooded owing to heavy rainfall, and several submerged islands can be seen.
- In response to Hurricane Dorian, the Copernicus Emergency Mapping Service was activated. The service uses observations from several Earth observation satellites, such as Copernicus Sentinel-1 and-2, to provide flood, risk and recovery maps.
• February 14, 2020: For Valentine’s Day, we bring you this Copernicus Sentinel-2 image capturing a beautiful heart-shaped geographical formation in the dramatic landscape of the southern highlands of Bolivia. 108)
- The highlands are part of the Altiplano, meaning High Plateau, a region that stretches almost 1000 km from Peru to Bolivia. The landscape consists of a series of basins lying about 3500 m above sea level and is the most extensive area of high plateau on Earth, outside Tibet.
- This particular area featured here is a transition between the desert in the west and the tropical forest in the east. The heart-shaped formation has been molded by many layers of different geological formations over time. The many streams and rivers visible in this image have also contributed to the shaping of the landscape as we see it today.
- Satellites, such as Copernicus Sentinel-2, allow us to capture beautiful images such as these from space, but also to monitor changing places on Earth. Flying 800 km above, satellites take the pulse of our planet by systematically imaging and measuring changes taking place, which is particularly important in regions that are otherwise difficult to access. This allows for informed decisions to be made to help protect our world for future generations and for all citizens that inhabit our beloved Earth.
- We are sending all our love for Valentine’s Day from the high plateaus of Bolivia – and hope we continue our celebration of love for Earth every day of the year.

Figure 103: This false-color composite image of Sentinel-2 was processed by selecting spectral bands that can be used for classifying geological features – but here the image processing also highlights this lovely heart for today’s image. Sucre, the capital of the Chuquisaca Department, is visible at the top of the image in grey. Designated a UNESCO World Heritage Site, the city lies at an elevation of around 2800 m above sea level. To the left of Sucre, the Maragua crater can be seen – a popular hiking destination. This image, which was captured on 26 January 2020, is also featured on the Earth from Space video program (image credit: ESA, the image contains modified Copernicus Sentinel data (2020), processed by ESA, CC BY-SA 3.0 IGO)
• February 12, 2020: The Pine Island Glacier recently spawned an iceberg over 300 km2 that very quickly shattered into pieces. This almost cloud-free image, captured on 11 February by the Copernicus Sentinel-2 mission, shows the freshly broken bergs in detail (Figure 104). 109)
- A recent animation using 57 radar images captured by the Copernicus Sentinel-1 mission shows just how quickly the emerging cracks from the glacier grew – leading to this historic calving event.
- Thanks to the combination of both optical and radar images from the Copernicus Sentinel satellite missions, growing cracks were spotted in the Pine Island Glacier last year, and since then, scientists have been keeping a close eye on how quick the cracks were growing.
- The Pine Island Glacier, along with its neighbor Thwaites glacier, connect the center of the West Antarctic Ice Sheet with the ocean, and together discharge significant quantities of ice into the ocean.

Figure 104: This image of the Pine Island Glacier, captured on 11 February 2020 by the Copernicus Sentinel-2 mission, shows the freshly broken bergs in detail (image credit: ESA, the image contains modified Copernicus Sentinel data (2020), processed by ESA, CC BY-SA 3.0 IGO)
• January 31, 2020: World Wetlands Day is celebrated internationally each year on 2 February. It marks the anniversary of the signing of the Convention on Wetlands of International Importance, known as the Ramsar Convention, in Ramsar, Iran, on 2 February 1971. 110)
- World Wetlands Day raises global awareness about the vital role of wetlands for our planet, paying particular attention to wetland biodiversity.
- The equatorial lake (Figure //directory.eoportal.org/web/eoportal/satellite-missions/c-missions/copernicus-sentinel-2#lh@CU13afHerb" style="color: rgb(0, 155, 207);">105) covers an area of around 250 km2 and has an average depth of around 2.4 meters. Lake George is fed by a complex system of rivers and streams originating from the Rwenzori mountains – supplying a system of permanent swamps surrounding the lake.
- A dense fringe of wetland grass, visible in bright green, can be seen around the edges of the lake in the center of the image.
- The wetlands provide a natural living space for a number of mammals including elephants, hippopotamus and antelope. They also provide a habitat for over 150 species of birds including several rare species such as the saddle-billed stork.
- Seen from above, the waters of Lake George appear green as a result of the thick concentration of blue-green algae. Metal pollution, mine seepage and agricultural runoff has caused serious pollution to the lake’s waters and are severely impacting the lake’s health.
- Lake George drains through the Kazinga Channel in the image’s center. The wide, 32km long channel connects Lake George with Lake Edward, which lies on the border between Uganda and the Democratic Republic of the Congo.
- The Kazinga Channel flows through the Queen Elizabeth National Park. The almost 2000 km2 park is known for its wildlife including the African buffalo and the Nile crocodile.
- The park is also famous for its volcanic features, including volcanic cones and deep craters which can be seen dotted around the image. Many contain crater lakes, including the Katwe crater lake, whose salt deposits have been mined for centuries.

Figure lh@CU13afHerb" style="color: rgb(0, 155, 207);" name="lh@CU13afHerb">105: This Copernicus Sentinel-2 image takes us over Lake George, in western Uganda. In 1988, Lake George was designated as Uganda’s first Ramsar site, given its importance as a center for biological diversity. This image is also featured on the Earth from Space video program (image credit: ESA, the image contains modified Copernicus Sentinel data (2018), processed by ESA, CC BY-SA 3.0 IGO)
• January 24, 2020: This Copernicus Sentinel-2 image features an area in the Santa Cruz Department of Bolivia, where part of the tropical dry forest has been cleared for agricultural use. 111)
- Since the 1980s, the area has been rapidly deforested owing to a large agricultural development effort where people from the Andean high plains (the Altiplano region) have been relocated to the lowlands of Bolivia.
- The relatively flat lowlands and abundant rainfall make this region suitable for farming. In fact, the local climate allows farmers to benefit from two growing seasons. The region has been transformed from dense forest into a patterned expanse of agricultural land. This deforestation method, common in this part of Bolivia, is characterized by the radial patterns that can be seen clearly in the image.
- Each patterned field is approximately 6.25 km2 and each side is around 2.5 km long (Figure 106).
- Small settlements can be seen in the center of each individual field in the image, which typically contain a church, a school and a soccer field. These communities are joined by a road network depicted by the straight lines that bisect the radial fields and connect the adjacent areas.
- Meandering streams and rivers can be seen flowing through the fields. The long, thin strips of land in the top right of the image are most likely cultivated soybean fields.
- Rainforests worldwide are being destroyed at an alarming rate. This is of great concern as they play an important role in global climate, and are home to a wide variety of plants and animals.
- Because of their unique perspective from space, Earth observation satellites are instrumental in providing comprehensive information on the full extent and rate of deforestation, which is particularly useful for monitoring remote areas.

Figure 106: This composite image was created by combing three separate ‘Normalized Difference Vegetation Index’ images from the Copernicus Sentinel-2 mission. The first image, from 8 April 2019, is visible in red; the second from 22 June 2019, can be seen in green; and the third from 5 September 2019 can be seen in blue. The Normalized Difference Vegetation Index is widely used in remote sensing as it gives scientists an accurate measure of healthy and status of plant growth. This image is also featured on the Earth from Space video program (image credit: ESA, the image contains modified Copernicus Sentinel data (2019), processed by ESA, CC BY-SA 3.0 IGO)
• January 23, 2020: The Philippines’ Taal volcano erupted on 12 January 2020 – spewing an ash plume approximately 15 km high and forcing large-scale evacuations in the nearby area. 112)
- The optical image of Figure 107 has also been processed using the mission’s short-wave infrared band to show the ongoing activity in the crater, visible in bright red. Ash blown by strong winds can be seen in Agoncillo, visible southwest of the Taal volcano. Ash has also been recorded in other areas of the Batangas province, as well as Manila and Quezon.
- According to The Philippine Institute of Volcanology and Seismology bulletin published today, sulphur dioxide emissions were measured at an average of around 140 tons. The Taal volcano still remains on alert level four, meaning an explosive eruption is possible in the coming hours or days. The highest alert level is five which indicates an eruption is taking place.
- According to the National Disaster Risk Reduction and Management Council, over 50,000 people have been affected so far. In response to the eruption, the Copernicus Emergency Mapping Service was activated. The service uses satellite observations to help civil protection authorities and, in cases of disaster, the international humanitarian community, respond to emergencies.

Figure 107: This almost cloud-free image was captured today 23 January at 02:20 GMT (10:20 local time) by the Copernicus Sentinel-2 mission, and shows the island, in the center of the image, completely covered in a thick layer of ash (image credit: ESA, the image contains modified Copernicus Sentinel data (2020), processed by ESA, CC BY-SA 3.0 IGO)
• January 15, 2020: Heavy rainfall has triggered flooding in southern Iran, particularly in the Sistan and Baluchestan, Hormozgan and Kerman provinces. The downpour has led to blocked roads and destroyed bridges, crops and houses – displacing thousands of people. 113)
- The flooding has also affected Zahedan, as well as Konarak, Saravan, Nik Shahr, Delgan, Bazman, Chabahar, Zarābād and Khash.
- In response to the flood, the Copernicus Emergency Mapping Service was activated. The service uses satellite observations to help civil protection authorities and, in cases of disaster, the international humanitarian community, respond to emergencies.

Figure 108: This image, captured by the Copernicus Sentinel-2 mission, shows the extent of the flooding in the Sistan and Baluchestan province on 13 January 2020. Flooded areas are visible in brown, while the flooded villages are highlighted by dotted circles. Sediment and mud, caused by the heavy rains, can be seen gushing from the Bahu Kalat River, Iran, and Dasht River, Pakistan, into Gwadar Bay (image credit: ESA, the image contains modified Copernicus Sentinel data (2020), processed by ESA, CC BY-SA 3.0 IGO)
• January 10, 2020: The Copernicus Sentinel-2 mission takes us over the Faroe Islands, located halfway between Iceland and Norway in the North Atlantic Ocean. The Faroe Islands are an archipelago made up of 18 jagged islands and are a self-governing nation under the external sovereignty of the Kingdom of Denmark. 114)
- The archipelago is around 80 km wide and has a total area of approximately 1400 km2. The official language of the Faroe Islands is Faroese, a Nordic language which derives from the language of the Norsemen who settled the islands over 1000 years ago.
- The islands have a population of around 50,000 inhabitants – as well as 70,000 sheep. Around 40% of the population reside in the capital and largest city of the Faroe Islands, Tórshavn, visible on the island of Streymoy, slightly above the center of the image.
- The islands are a popular destination for birdwatchers, particularly on the island of Mykines, the westernmost island of the Faroese Archipelago. The island provides a breeding and feeding habitat for thousands of birds, including the Atlantic Puffins.
- Several inland water bodies can be seen dotted around the islands. Lake Sørvágsvatn, the largest lake of the Faroe Islands, is visible at the bottom of Vágar Island to the right of Mykines. Vágar Airport, the only airport in the Faroe Islands, can be seen left of the lake.
- The official language of the Faroe Islands is Faroese, a Nordic language which derives from the language of the Norsemen who settled the islands over 1000 years ago.
- The islands are particularly known for their dramatic landscape, grass-roofed houses and treeless moorlands. The Faroe Islands boast over 1000 km of coastline and because of their elongated shape, one can never be more than five km to the ocean from any point of the islands.

Figure 109: In this image of Sentinel-2, captured on 21 June 2018, several clouds can be seen over the Northern Isles, top right of the image. Low vegetation is visible in bright green. The unique landscape of the Faroe Islands was shaped by volcanic activity approximately 50 to 60 million years ago. The original plateau was later restructured by the glaciers of the ice age and the landscape eroded into an archipelago characterized by steep cliffs, deep valleys and narrow fjords. This image is also featured on the Earth from Space video program (image credit: ESA, the image contains modified Copernicus Sentinel data (2018), processed by ESA, CC BY-SA 3.0 IGO)
• January 9, 2020: Ferocious bushfires have been sweeping across Australia since September, fuelled by record-breaking temperatures, drought and wind. The country has always experienced fires, but this season has been horrific. A staggering 10 million hectares of land have been burned, at least 24 people have been killed and it has been reported that almost half a billion animals have perished. 115)

Figure 110: The Copernicus Sentinel-2 mission has been used to image the fires. The Sentinel-2 satellites each carry just one instrument – a high-resolution multispectral imager with 13 spectral bands. The smoke, flames and burn scars can be seen clearly in the image shown here, which was captured on 31 December 2019. The large brownish areas depict burned vegetation and provide an idea of the size of the area affected by the fires here – the brown ‘strip’ running through the image has a width of approximately 50 km and stretches for at least 100 km along the Australian east coast (image credit: ESA, the image contains modified Copernicus Sentinel data (2019), processed by ESA, CC BY-SA 3.0 IGO)
Sentinel 2 continued
Sensor complement: (MSI)
MSI (Multispectral Imager):
The instrument is based on the pushbroom observation concept. The telescope features a TMA (Three Mirror Anastigmat) design with a pupil diameter of 150 mm, providing a very good imaging quality all across its wide FOV (Field of View). The equivalent swath width is 290 km. The telescope structure and the mirrors are made of silicon carbide (SiC) which allows to minimize thermoelastic deformations. The VNIR focal plane is based on monolithic CMOS (Complementary Metal Oxide Semiconductor) detectors while the SWIR focal plane is based on a MCT (Mercury Cadmium Telluride) detector hybridized on a CMOS read-out circuit. A dichroic beamsplitter provides the spectral separation of VNIR and SWIR channels. 116) 117) 118) 119) 120) 121) 122)
Airbus DS (former EADS Astrium SAS) of Toulouse is prime for the MSI instrument. The industrial core team also comprises Jena Optronik (Germany), Boostec (Bazet, France), Sener and GMV (Spain), and AMOS, Belgium. The VNIR detectors are built by Airbus DS-ISAE-e2v, while the French company Sofradir received a contract to provide the SWIR detectors for MSI.
Calibration: A combination of partial on-board calibration with a sun diffuser and vicarious calibration with ground targets is foreseen to guarantee a high quality radiometric performance. State-of-the-art lossy compression based on wavelet transform is applied to reduce the data volume. The compression ratio will be fine tuned for each spectral band to ensure that there is no significant impact on image quality.
The observation data are digitized on 12 bit. A shutter mechanism is implemented to prevent the instrument from direct viewing of the sun in orbit and from contamination during launch. The average observation time per orbit is 16.3 minutes, while the peak value is 31 minutes (duty cycle of about 16-31%).

Figure 111: MSI instrument architecture (image credit: ESA)
|
Imager type |
Pushbroom instrument |
|
Spectral range (total of 13 bands) |
0.4-2.4 µm (VNIR + SWIR) |
|
Spectral dispersion technique |
Dichroic for VNIR and SWIR split |
|
Mirror dimensions of telescope |
M1 = 440 mm x 190 mm |
|
SSD (Spatial Sampling Distance) |
10 m: (VNIR) B2, B3, B4, B8 (4 bands) |
|
Swath width |
290 km, FOV= 20.6º |
|
Detector technologies |
Monolithic Si (VNIR); hybrid HgCdTe CMOS (SWIR) |
|
Detector cooling |
Cooling of SWIR detector to < 210 K |
|
Data quantization |
12 bit |
|
Instrument mass, power |
~290 kg, < 266 W |
|
Data rate |
450 Mbit/s after compression |
Table 6: MSI instrument parameters
Spectral bands: MSI features 13 spectral bands spanning from the VNIR (Visible and Near Infrared) to the SWIR (Short-Wave Infrared), featuring 4 spectral bands at 10 m, 6 bands at 20 m and 3 bands at 60 m spatial sampling distance (SSD), as shown in Figure 114.
|
VNIR (Visible and Near Infrared) |
SWIR (Short-Wave Infrared) |
|
Monolithic CMOS (Complementary Metal–Oxide–Semiconductor) |
MCT, CTIA (Capacitive Feedback Transimpedance Amplifier) ROIC |
|
10 filters |
3 filters |
|
7.5-15 µm pitch |
15 µm pitch |
|
31,152-15,576 pixels |
15,576 pixels |
|
293K |
195±0.2K |
|
1 TDI (Time Delay Integration) stage for 2 lines |
1 TDI stage for 2 lines, 2 additional lines for pixel deselection |
Table 7: Specification of VNIR and SWIR FPAs 123)

Figure 112: The MSI instrument (left) and the associated VNIR focal plane (right), image credit: Airbus DS-ISAE-e2v

Figure 113: Left: VNIR FPA (image credit: Airbus DS-F, ev2); right: SWIR FPA (image credit: Airbus DS-F, Sofradir)

Figure 114: MSI spatial resolution versus waveleng: Sentinel-2’s span of 13 spectral bands, from the visible and the near-infrared to the shortwave infrared at different spatial resolutions ranging from 10 to 60 m on the ground, takes land monitoring to an unprecedented level(image credit: ESA)
|
Spectral bands (center wavelength in nm/SSD in m) |
Mission objective |
Measurement or calibration |
|
B1 (443/20/60), B2 (490/65/10) & |
Aerosols correction |
|
|
B8 (842/115/10), B8a (865/20/20), |
Water vapor correction |
|
|
B10 (1375/20/60) |
Circus detection |
|
|
B2 (490/65/10), B3 (560/35/10), B4 (665/30/10), |
Land cover classification, |
|
Table 8: MSI spectral band specification
The filter-based pushbroom MSI instrument features a unique mirror silicon carbide off-axis telescope (TMA) with a 150 mm pupil feeding two focal planes spectrally separated by a dichroic filter. The telescope comprises three aspheric mirrors: M2 mirror is a simple conic surface, whereas the other mirrors need more aspherization terms. The spectral filtering onto the different VNIR and SWIR spectral bands is ensured by slit filters mounted on top of the detectors. These filters provide the required spectral isolation.
CMOS and hybrid HgCdTe (MCT) detectors are selected to cover the VNIR and SWIR bands. The MSI instrument includes a sun CSM (Calibration and Shutter Mechanism). The 1.4 Tbit image video stream, once acquired and digitized is compressed inside the instrument.
The instrument carries one external sensor assembly that provides the attitude and pointing reference (star tracker assembly) to ensure a 20 m pointing accuracy on the ground before image correction.
The detectors are built by Airbus Defence and Space-ISAE-e2v: they are made of a CMOS die, using 0.35µm CMOS process, integrated in a ceramic package (Figure 115). The VNIR detector has ten spectral bands, two of them featuring an adjacent physical line allowing TDI operating mode, with digital summation performed at VCU (Video and Compression Unit) level. On-chip analog CDS (Correlated Double Sampling) allows to reach a readout noise of the order of 130 µV rms. For each detector, the ten bands are read through 3 outputs at a sample rate of 4.8MHz. The detector sensitivity has been adjusted for each band through CVF (Charge to Voltage conversion Factor) in view of meeting SNR specifications for a reference flux, while avoiding saturation for maximum flux. A black coating deposition on the non-photosensitive area of the CMOS die is implemented to provide high straylight rejection.

Figure 115: Illustration of the MSI VNIR detector (image credit: Airbus DS, Ref. 120)

Figure 116: MSI electrical architecture (image credit: Astrium SAS, Ref. 119)
The filter assemblies are procured from Jena Optronik (JOP) in Germany. A filter assembly is made of filter stripes (one for each spectral band) mounted in a Titanium frame. The aims of the filter assembly are: i) to separate VNIR spectral domain into the ten bands B1 to B9, ii) to prevent stray light effects. This stray light limitation is very efficient since it is made very close to the focal plane. Each filter stripe, corresponding to each spectral band, is aligned and glued in a mechanical mount. A front face frame mechanically clamps the assembly together.
The FEE (Front End Electronics) are procured from CRISA in Spain. Each FEE unit provides electrical interfaces to 3 detectors (power supply, bias voltages, clock and video signals) plus video signal filtering and amplification.
Video and Compression Unit (VCU) is manufactured by JOP and aims i) at processing the video signals delivered by the FEEs : digitization on 12 bits, numerical processing, compression and image CCSDS packet generation, ii) interfacing with the platform (power supply, MIL-BUS, PPS), iii) providing the nominal thermal control of the MSI.

Figure 117: Internal configuration of MSI (image credit: EADS Astrium)

Figure 118: Mechanical configuration of the telescope (image credit: EADS Astrium)
The mechanical structure of MSI instrument holds the 3 mirrors, the beam splitter device, the 2 focal planes and 3 stellar sensors. It is furthermore mounted on the satellite through 3 bolted bipods. This main structure (Figure 118) has a size of 1.47 m long x 0.93 m wide x 0.62 m high with a mass of only 44 kg.
The optical face of these mirror blanks have been grounded by Boostec before and after CVD coating (i.e. before polishing), with a shape defect of few tens of a µm. M1 and M2 are designed to be bolted directly on the main SiC structure. M3 is mounted on the same structure through glued bipods. 124)
|
Mirror |
Shape |
Mounting |
Size (mm) |
Mass |
|
M1 |
aspheric of-axis concave |
central fixture at back side |
442 x 190 |
2.3 kg |
|
M2 |
aspheric on-axis convex |
central fixture at back side |
147 x 118 |
0.3 kg |
|
M3 |
aspheric of-axis concave |
glued bipods on outer edges |
556 x 291 |
5.1 kg |
Table 9: MSI mirror characteristics
Mirror manufacturing: The mirror optomechanical design was performed by EADS-Astrium on the basis of the SiC-100 sintered silicon carbide from Boostec who produced the mirror blanks and delivered them to AMOS (Advanced Mechanical and Optical Systems), Liege, Belgium. AMOS is in charge of the deposition of a small layer of CVD-SiC (Chemical Vapor Deposition-Silicon Carbide) on the mirror. The purpose is to generate a non-porous cladding on the mirror surface which allows the polishing process reaching a microroughness state, compatible with the system requirements regarding straylight. 125)

Figure 119: Optical elements and schematic layout of the MSI telescope (image credit: EADS Astrium)
VNIR and SWIR focal plane assemblies: Both focal planes accommodate 12 elementary detectors in two staggered rows to get the required swath. The SWIR focal plane operates at -80ºC whereas the VNIR focal plane operates at 20ºC. Both focal planes are passively cooled. A monolithic SiC structure provides support to the detectors, the filters and their adjustment devices and offers a direct thermal link to the radiator.

Figure 120: Focal plane configuration (image credit: EADS Astrium)
Filters and detectors: Dedicated strip filters,mounted on top of each VNIR or SWIR detector, provide the required spectral templates for each spectral band. The VNIR detector is made of a CMOS die, using the 0.35 µm CMOS technology, integrated in a ceramic package. The detector architecture enables “correlated double.”
The so-called VNIR Filter Assembly contains 10 VNIR bands (from 443 nm to 945 nm) and the so-called SWIR Filter Assembly includes 3 SWIR bands (from 1375 nm to 2190 nm). The sophisticated development of the filter assemblies is caused by the specified spectral performance parameters and the high stray light requirements due to the topology of the spectral bands. 126)
Sampling for the 10 VNIR spectral bands along with TDI (Time Delay IntegrationI) mode for the 10 m bands. Black coating on the die eliminates scattering.

Figure 121: Photo of the VNIR (top) and SWIR spectral filter assemblies (image credit: Jena Optronik)

Figure 122: Photo of a CMOS detector with black coating (image credit: EADS Astrium)
The SWIR detector is made of an HgCdTe photosensitive material hybridized to a silicon readout circuit (ROIC) and integrated into a dedicated hermetic package. The SWIR detector has three spectral bands for which the spectral efficiency has been optimized. The B11 and B12 bands are being operated in (TDI) mode.

Figure 123: Photo of the EM model of the SWIR detector at hybridization stage (image credit: Sofradir)
CSM (Calibration and Shutter Mechanism): In MSI, the two functions of calibration and shutter are gathered in one single mechanism to reduce mass, cost and quantity of mechanisms of the instrument, increasing its reliability at the same time. The CSM is located at the entrance of MSI, a rectangular device of ~ 80 cm x 30 cm, mounted on the frame of the secondary structure. The design and development of the CSM is provided by Sener Ingenieria y Sistemas, S.A., Spain. 127)

Figure 124: Photo of the CSM (Calibration and Shutter Mechanism) mechanical configuration (image credit: Sener)
Requirements and design drivers:
• During launch the CSM has to protect the instrument from sun illumination and contamination by covering the instrument entrance with a rectangular plate (named the door). This is the close position, which has to be maintained under the action of the launch loads.
• Once in orbit, the following functions are required from the CSM:
- To allow Earth observation to the instrument (MSI) the door needs to rotate from the close position 63º inwards the instrument and maintain it stable without power. This is the open position.
- From time to time, in calibration mode of the MSI, the CSM inserts a sun diffuser in front of the primary mirror and the sun diffuser is illuminated by direct solar flux. This mode corresponds to a door position located 55º from the close position outward the instrument. This position must be also stable without any power supply.

Figure 125: Sentinel-2A/MSI sun diffuser. Size: 700 x 250 mm2 ensuring calibration of each pixel into the FOV (image credit: Airbus DS-F)
- In case of emergency, the CSM has to rotate the door to the close position from any initial position to prevent the sun light to heat sensible components of the instrument. Similarly to the previous positions, the close position shall be stable without power supply.

Figure 126: View of the CSM in calibration position (image credit: Sener)
A face to face ball bearing as rotation axis hinge in the opposite side of the actuator is used supported by means of an axially flexible support. Apart from that the pinpuller mounted on a flexible support, holds the door during launch by means of a cylindrical contact with respect to the door bushing. This design is the result of the optimization made in order to reach a stiff and robust but light and hyper-statically low constrained mechanism to make it compatible under possible thermal environments.
The pinpuller provides a reliable launch locking device and allows after pin retraction the mechanism to rotate in both senses.
The MSI instrument design represents state-of-the-art technology on many levels that is being introduced for next generation European land-surface imagers. Obviously, its performance will set new standards for future spaceborne multispectral imagers.
Storage technology introduction:
MMFU (Mass Memory and Formatting Unit):
The introduction of MMFU by EADS Astrium GmbH and IDA (Institut für Datentechnik und Kommunikationsnetze) at TU Braunschweig represents a new spaceborne storage technology based on SLC (Single Level Cell) NAND-Flash memory devices.
Note: NAND (Not And) is a Boolean logic operation that is true if any single input is false. Two-input NAND gates are often used as the sole logic element on gate array chips, because all Boolean operations can be created from NAND gates.
The NAND storage technology is not only an established technology in commercial applications but represents also a real and effective alternative for mass memory systems in space. The main advantages of the NAND-Flash technology are: a) the non-volatile data storage capability and b) the substantially higher storage density.
In the commercial world the NAND technology has become the preferred solution for storing larger quantities of data on devices such as SSDs (Solid State Drives), USB (Universal Serial Bus) Flash memory sticks, digital cameras, mobile phones and MP3-Players. In the space business, this technology has been used in some experiments only, but not in the frame of large scale mass memory systems. This is now going to be changed. 128) 129) 130)
Astrium and IDA have continuously worked for over seven years on the subject “NAND-Flash Technology for Space”. In the frame of an ESA study dubbed SGDR (Safe Guard Data Recorder) this NAND-Flash technology has been introduced and intensively evaluated.
As a result of this extensive testing, the radiation effects of this technology are well known meanwhile and appropriate error handling mechanisms to cope with the observed effects have been developed. For the S2 (Sentinel-2) mission, a complete qualification program has been performed including radiation tests, assembly qualification, construction analysis, electrical characterization, reliability tests like burn-in, destructive physical analysis, stress and life tests.
All these investments led to the final conclusion that the selected SLC NAND-Flash is an adequate technology for high capacity memory systems for space, even for systems with very high data integrity requirements.
Table 10 lists some main requirements and provides in parallel the related figures of two Astrium MMFU implementations. The first implementation is based on SLC NAND-Flash devices and will be launched with the Sentinel 2 satellite. The second option uses SDR-SDRAM devices, which was the initially required baseline technology for this mission.
|
Parameter |
Requirement |
Astrium MMFU |
|
|
NAND-Flash |
SDR-SDRAM |
||
|
User storage capacity |
2.4 Tbit (EoL) |
6 Tbit (BoL) |
2.8 Tbit (BoL) |
|
No of memory modules |
- |
3 |
11 |
|
Mass |
≤ 29 kg |
< 15 kg |
< 27 kg |
|
Max volume (L x H x W) |
710 mm x 260 mm x 310 mm |
345 mm x 240 mm x 302 mm |
598 mm x 240 mm x 302 mm |
|
Power (record & replay) |
≤ 130 W |
< 54 W |
< 126 W |
|
Power (data retention) |
- |
< 29 W (0 W) |
< 108 W |
|
Instrument input data rate |
490 Mbit/s + 80 kbit/s (housekeeping) |
||
|
Output data rate (downlink) |
2 x 280 Mbit/s |
||
|
Life time in orbit |
up to 12.5 years |
||
|
Reliability |
≥ 0.98 |
0.988 |
> 0.98 |
|
Bit error rate (GCR) per day |
≤ 9 x 10-13 / day |
5.9 x 10⁻¹⁴ / day |
< 9 x 10-13 / day |
Table 10: Sentinel-2 MMFU requirements and resulting implementations
The related simplified architectural block diagram of the Astrium Sentinel-2 MMFU is shown in Figure 127. The MMFU receives two parallel data streams either from the nominal or redundant VCU (Video Compression Unit). The interfaces are cross-strapped with redundant PDICs (Payload Data Interface Controllers). After reception and adaptation to internal data formats of the received source packets, the data is stored in memory modules. FMM (Flash Memory Module) and respectively SMM for the SDR-SDRAM memory module. For replay, the data is read out from two parallel operated memory modules and routed via two active TFGs (Transfer Frame Generators) providing interfaces for downlink and test. The system is controlled by a Memory System Supervisor, which is based on an ERC32 processor. The required supply voltages are provided by a power converter.

Figure 127: Architecture of the MMFU system (image credit: Astrium)
Each function is implemented by nominal and redundant hardware components. The functions and boards are summarized in Table 11:
|
Function |
MMFU with NAND-Flash |
MMFU with SDR-SDRAM |
||
|
Modules (Functions) |
Boards (Physical Assembly) |
Modules (Functions) |
Boards (Physical Assembly) |
|
|
Memory System Supervisor |
2 |
2 |
2 |
2 |
|
Payload Data Interface Controller |
2 |
1 |
2 |
1 |
|
Memory Modules |
3 |
3 |
11 |
11 |
|
Transfer Frame Generators |
4 |
2 |
4 |
2 |
|
Power Converters |
2 |
2 |
2 |
2 |
|
Total Board Count |
10 |
18 |
||
Table 11: Number of functions and boards
Storage capacity: Astrium uses for all boards a standard format. Therefore the maximum number of memory and other devices which can be assembled on one board is limited by this form factor. Both types of memory modules are nearly identical in form, fit and function and because they can be mutually replaced; this represents a good basis for comparison.
The selected NAND-Flash device provides a capacity of 32 Gbit plus some spare. It is realized by means of four 8 Gbit dies encapsulated in a standard TSOP1 package. In total, the FMM (Flash Memory Module) includes 76 devices. The devices are arranged in four partitions which can be independently powered. A partition represents also the lowest level for reconfiguration. Each partition contains sixteen devices to store user data and three devices that are used to store parity information. This configuration enables single symbol error correction and double symbol error detection.
The SDRAM based memory module has a similar organization. There are also four partitions and each devices for single symbol error correction. A device is represented by a stack which contains eight SDRAM chips with a capacity of 512 Mbit each. From this follows the user storage capacity per memory module and some other parameters as listed in Table 12.
The number of FMM modules is determined by the total data rate and the operational concept, which requires the operation of two independent data streams. Therefore there are two memory modules operated in parallel. The third one is provided for redundancy.
The number of SMM modules is mainly determined by the required capacity. Also here two modules are operated in parallel and one SMM is included for reliability reasons.
|
Performance data |
Unit |
SLC NAND-FMM (Flash Memory Module) |
SDR-SMM (SDRAM Memory Module) |
|
Baseline technology |
NAND-Flash |
SDR |
|
|
Device package |
Quad Die Stack TSOP I |
Eight Die Stack TSOP II |
|
|
Die capacity |
Gbit |
8 |
0.5 |
|
Device capacity |
Gbit |
32 |
4 |
|
Partition organization |
devices |
16+3 |
16+2 |
|
Data bus width |
bit |
128+24 |
128+16 |
|
Partition net capacity |
Gbit |
512 |
64 |
|
Count of partitions per module |
4 |
4 |
|
|
Count of devices per module |
76 |
72 |
|
|
Module net capacity |
Gbit |
2048 |
256 |
|
Accessible unit (read/write) |
kbyte |
256 |
0.5 (by design) |
|
Accessible unit (erase) |
MByte |
16 |
N/A |
|
Type of module data interfaces |
Channel link |
Channel link |
|
|
Max. Input data rate |
Mit/s |
800 |
2400 |
|
Max. Output data rate |
Mbit/s |
800 |
1200 |
|
Module power (max data rate) |
W |
10.5 |
14 |
|
Module power (data retention) |
W |
0 (4) |
8 |
|
Module size |
mm x mm |
200 x 243.5 |
200 x 243.5 |
|
Module mass |
kg |
0.85 |
1.15 |
Table 12: Performance characteristics of Astrium Sentinel 2 MMFU memory modules
The much higher storage density of the NAND-Flash devices (factor of 8) leads to a massive reduction in the number of required memory modules. For a mass memory system this becomes especially evident, if there is a requirement for a large user capacity as in case of the Sentinel-2 MMFU. Further positive aspects evolve with reduction of the number of modules. The complete system design from electrical and mechanical point of view is greatly relaxed.
Mass and volume: With reduction of the number of memory modules, it is obvious that directly related physical budgets like mass and volume, decline accordingly. Mass is always a critical issue for space missions which can be reduced by using NAND-Flash technology; but also the complete system design of a satellite, in terms of mass, power, thermal and other aspects, can be positively influenced by applying NAND-Flash based memory systems. In case of the Sentinel-2 MMFU, indeed 14 Kg (about 50%) can be saved.
Power: The power consumption is also reduced by more than 50% (Table 10). This is mainly caused by the number of memory modules operated in parallel. In case of Flash, there are only two active memory modules. In case of the SDRAM technology, 10 memory modules are operated in parallel: up to four modules for data access, two modules for read, two modules for write, and all other modules in data retention mode. Data retention means that the modules store user data and the SDRAM chips have to be refreshed and scrubbed for error detection and correction.
In contrast, a Flash-based memory module can be completely switched off without loss of data in the data retention mode. For a minimum, the partitions can be switched off and the power consumption of the controller part of the module is reduced due to low activity.
It is not obvious, that, in all cases, NAND-Flash consumes less power than SDR-SDRAM based systems. The power consumption depends on several factors like required storage capacity, data rates and operations. Generally it can be said, that as long as the required storage capacity determines the number of memory devices, Flash might be the better choice. If the number of memory devices is determined by the required data rate, SDRAM based systems may have a better performance from a power consumption point of view.
Data rates: Table 13 shows that SDR-SDRAM devices provide a much better performance from data rate point of view. The overall performance of a memory module depends on further characteristics like type of interfaces, memory controller performance, and maximum power consumption and others. Generally an SDRAM based memory module has advantages in terms of access speed.
|
Performance parameter |
SLC NAND-Flash |
SDR-SDRAM |
|
Die capacity (not stacked) |
8 Gbit |
512 Mbit |
|
Operating voltage |
2.7 V – 3.6 V |
3.0 V – 3.6 V |
|
Data bus width |
8 bit |
8 bit |
|
Temperature range (std. available) |
- 40ºC to + 85ºC |
0ºC to +70ºC |
|
Maximum read performance @ IO clock |
< 250 Mbit/s @ 40 MHz on page level (4 k x 8) |
< 800 Mbit/s @ 100 MHz burst operation |
|
Erase time |
2 ms on block level (256 k x 8) |
N/A |
|
Endurance |
> 105 |
∞ |
|
Data retention |
10 years |
N/A |
Table 13: Performance characteristics of the memory devices
The lower performance of NAND-Flash is determined by three characteristics. During writing the NAND-Flash devices need to be programmed and this takes a time of about 700 µs per 4 kbyte data (one device page). Additionally the so-called blocks of a NAND-Flash device have to be erased before programming. This consumes another 2 ms per block (64 pages). Last but not least, the selected NAND-Flash devices use an eight bit interface for serial commanding, addressing and data transfer with a maximum operating frequency of 40 MHz.
This lack in performance can be mitigated by mainly two measures. The first straight forward measure is parallel operation of NAND-Flash devices. The second measure is interleaved access to several NAND-Flash devices. Interleaving uses the programming time of a NAND-Flash device to write in parallel the next device. These methods allow increasing the write access performance.
Life time and reliability: NAND-Flash devices provide a limited endurance. This is caused by an inherent wear out mechanism of the Flash memory cells which limits the number of erase and write cycles to about 105 cycles. To mitigate the endurance limitation, most Flash memory systems are equipped with an address management system, which distributes the write accesses rather uniformly over the address space. This technique is called Wear Leveling.
Furthermore the very high device capacity of NAND-Flash devices offers the opportunity to implement a physical address space, which exceeds the required logical user address space by a factor of n. This enhances the wear out limit of the logical addresses by the factor of n too. Hence there are two methods to keep the total count of write accesses to the same physical address below the wear out limit.
Radiation and error rates: In general, sensitivity of electronic devices to space radiation is a major topic and is also shortly discussed here through a comparison of NAND-Flash and SDR-SDRAM devices.
The mass memory system based on NAND-Flash shows clear advantages and fits well to the high storage capacity and moderate data rates of the Sentinel-2 application. The very high storage density of the NAND-Flash devices leads to a reduced number of memory modules with advantages in terms of power consumption, mass and volume. Furthermore this feature improves the reliability and eases the system design from mechanical and electrical points of view.

Figure 128: Photo of the EQM (Engineering Qualification Model), Sentinel-2 MMFU (image credit: Astrium)
|
Storage capacity |
2400 Gbit (EOL) with Flash technology |
|
Input data rate |
2 x 540 Mbit/s |
|
Instrument mass, size |
14 kg, L: 302 x W: 345 x H: 240 mm |
|
Power consumption |
< 35 W |
|
Simultaneous record and replay |
|
|
Flexible real-time SW based embedded File Management System with PUS (Packet Utilization Standard) services |
|
|
CCSDS conform output Data Formatting at a data rate of 2 x 280 Mbit/s |
|
|
7.5 years lifetime in-orbit |
|
Table 14: Parameters of the Sentinel-2 MMFU 131)
Ground segment:
For Copernicus operations, ESA has defined the concept and architecture for the Copernicus Core ground segment, consisting of a Flight Operations System (FOS) and a Payload Data Ground Segment (PDGS). Whereas the flight operations and the mission control of Sentinel-1 and -2 is performed by ESOC (ESAs European Space Operations Center in Darmstadt, Germany), the operations of Sentinel-3 and the Sentinel-4/-5 attached payloads to meteorological satellites is performed by EUMETSAT.
The ground segment includes the following elements:
• Flight Operations Segment (FOS): The FOS is responsible for all flight operations of the Sentinel-2 spacecraft including monitoring and control, execution of all platform activities and commanding of the payload schedules. It is based at ESOC, Darmstadt in Germany and comprises the Ground Station and Communications Network, the Flight Operations Control Centre and the General Purpose Communication Network.
• Payload Data Ground Segment (PDGS): The PDGS is responsible for payload and downlink planning, data acquisition, processing, archiving and downstream distribution of the Sentinel-2 satellite data, while contributing to the overall monitoring of the payload and platform in coordination with the FOS.
The Service Segment, geographically decentralized, will utilize the satellite data in combination with other data to deliver customized information services to the final users.
The baseline ground station network will include four core X-band ground stations for payload observation data downlink and one S-band station for Telemetry, Tracking and Control (TT&C). To a limited extent, the system can also accommodate some direct receiving local user ground stations for Near-Real Time applications.
The systematic activities of the PDGS include the coordinated planning of the mission subsystems and all processes cascading from the data acquired from the Sentinel-2 constellation, mainly:
1) The automated and recurrent planning of the satellite observations and transmission to a network of distributed X-band ground stations
2) The systematic acquisition and safeguarding of all spacecraft acquired data, and its processing into higher level products ensuring quality and timeliness targets
3) The recurrent calibration of the instrument as triggered by the quality control processes
4) The automated product circulation across PDGS distributed archives to ensure the required availability and reliability of the data towards users
5) The long-term archiving of all mission data with embedded redundancy over the mission lifetime and beyond.

Figure 129: PGDS context in Sentinel-2 system (image credit: ESA)

Figure 130: The Sentinel-2 ground segment (image credit: ESA)

Figure 131: Physical layout of the PGDS ground stations (image credit: ESA) 132)
• CGS (Core Ground Stations: Matera (Italy), Maspalomas (Spain), Svalbard (Norway), Alaska (USA).
• PAC (Processing/Archiving Center): Farnborough (UK), Madrid (Spain)
• MPC (Mission Performance Center): TBD
• PDMC (Payload Data Management Center): ESA/ESRIN, Frascati, Italy.
|
Level-1 image processing includes: |
- a) Radiometric corrections: straylight/crosstalk correction and defective pixels exclusion, de-noising, de-convolution, relative and absolute calibration |
|
Level 2 image processing includes: |
- a) Cloud screening |
|
Level 3 provides spatio-temporal synthesis |
Simulation of cloud corrections within a Level 2 image |
Table 15: Sentinel-2 level-1 and level-2 products
Copernicus / Sentinels EDRS system operations:
EDRS (European Data Relay Satellite) will provide a data relay service to Sentinel-1 and -2 and initially is required to support 4 Sentinels simultaneously. Each Sentinel will communicate with a geostationary EDRS satellite via an optical laser link. The EDRS GEO satellite will relay the data to the ground via a Ka-band link. Optionally, the Ka-band downlink is planned to be encrypted, e.g. in support to security relevant applications. Two EDRS geo-stationary satellites are currently planned, providing in-orbit redundancy to the Sentinels. 133)
EDRS will provide the same data at the ground station interface as is available at the input to the OCP (Optical Communications Payload) on-board the satellites, using the same interface as the X-band downlink. The EDRS transparently adapts the Sentinels data rate and format to the internal EDRS rate and formats, e.g. EDRS operates at bit rates of 600 Mbit/s and higher.
With EDRS, instrument data is directly down-linked via data relay to processing and archiving centers, while other data continues to be received at X-band ground stations. The allocation of the data to downlink via X-band or EDRS is handled as part of the Sentinel mission planning system and will take into account the visibility zones of the X-band station network and requirements such as timeliness of data.

Figure 132: Sentinel missions - EDRS interfaces (image credit: ESA)
Copernicus / Sentinel data policy:
The principles of the Sentinel data policy, jointly established by EC and ESA, are based on a full and open access to the data:
• anybody can access acquired Sentinel data; in particular, no difference is made between public, commercial and scientific use and in between European or non-European users (on a best effort basis, taking into consideration technical and financial constraints);
• the licenses for the Sentinel data itself are free of charge;
• the Sentinel data will be made available to the users via a "generic" online access mode, free of charge. "Generic" online access is subject to a user registration process and to the acceptation of generic terms and conditions;
• additional access modes and the delivery of additional products will be tailored to specific user needs, and therefore subject to tailored conditions;
• in the event security restrictions apply to specific Sentinel data affecting data availability or timeliness, specific operational procedures will be activated.
ESA Member States approved these principles in September 2009. 134) 135) 136) 137) 138)
Sen2Coral (SEOM S24Sci Land and Water: Coral Reefs)
The objective of ESA’s SEOM (Scientific Exploration of Operational Missions) Program Sen2Coral is the preparation of the exploitation of the Sentinel-2 mission for coral reefs by developing and validating appropriate, open source algorithm available for the community. The project objectives are the scientific exploitation and validation of the Sentinel-2 MSI (Multispectral Instrument) for mapping (habitat, bathymetry, and water quality) and detection change for coral reef health assessment and monitoring, and algorithm development dedicated to Sentinel-2 capabilities to satisfying these objectives. 139)
To address the extremely interesting and challenging questions posed by this project a consortium of contractors with appropriate background knowledge and skills has been assembled. The consortium comprises:
• ARGANS Limited, UK
• CNR-IREA, Italy
• CS-SI, France
The consortium is complimented by a science team of consultants and partners who are recognized international scientists in the field.
Research Program:
• A critical analysis of feedback from scientists and institutions collected through consultations in ESA and Third Party workshops, symposia and conferences.
• Proposal of potential observation scenarii for Sentinel-2 in terms of required spatial coverage and repeat cycle considering user requirements, existing observation initiatives and synergy with other sensors (Landsat, SPOT sensor families).
• Identifying scientific priority areas and providing guidance for future scientific data exploitation projects. 140)
Tropical coral reefs are globally important environments both in terms of preservation of biodiversity and for the substantial economic value their ecosystem services provide to human communities. Managing and monitoring reefs under current environmental threats requires information on their composition and condition, i.e. the spatial and temporal distribution of benthos and substrates within the reef area. Determining the relative abundance of biotic types such as coral and macroalgae is the key for detecting and monitoring important biotic changes such as phase or regime shifts due to changes in environmental conditions. Coral bleaching events, where stressed corals expel their symbiotic algae and turn white in color, can provide indications of anthropogenic stressors and climate change impacts, while subsequent coral mortality may be a key determinant of future reef state. In addition to monitoring of current status, maps of benthos have the potential to inform management decisions such as the placement of marine protected areas and could in the future be used to seed models to predict ecosystem dynamics.

Figure 133: Image of the North Palau Reef (Western Pacific), acquired with Sentinel-2A on Feb. 10, 2016 (image credit: ESA, Sen2Coral consortium)

Figure 134: Image of Fatu Huku (Pacific) acquired with Sentinel-2A on Feb. 11, 2016 (image credit: ESA, Sen2Coral consortium)

Figure 135: Image of Heron Island, Great Barrier Reef, acquired with Sentinel-2A on Jan. 31, 2016 (image credit: ESA, Sen2Coral consortium)
Project activities:
Background: The degradation of coral reefs is a fact, with 55% of reefs being affected by overfishing and destructive fishing methods, which as the most pervasive threats, whereas 25% of reefs are affected by coastal development and pollution from land, including nutrients from farming and sewage, while one tenth suffer from marine-based pollution (local pressures are most severe in South-East Asia, where nearly 95 per cent of coral reefs are threatened).
In addition the coral reefs’ ecosystems appear to be the first to respond to global climate changes, such as increased sea surface temperature (SST), ultraviolet radiation (UV) and acidification of seawater that results from higher levels of atmospheric CO2 concentration.
Sentinel-2 MSI Data Acquisition:
The MSI (Multispectral Instrument) of the Sentinel-2A mission offers several potential technical advantages in the remote sensing of coral reefs due to:
• 10 meter spatial resolution allowing improvement in visual interpretation of reef features, classification accuracy and bathymetry.
• Additional water penetrating optical band improving consistency under varying water conditions, reducing uncertainty in bottom type and bathymetric mapping, deeper bathymetric accuracy and ability to determine water optical properties.
• Additional NIR/SWIR bands enabling more consistent and accurate determination of atmospheric and surface glint correction.
• Short re-visit time enabling the use of image series to determine fundamental uncertainties for change detection.
• Addresses the current limited remote sensing acquisition plan covering the coast areas.

Figure 136: Overview of processing steps (image credit: Sen2Coral consortium)
Algorithm Development & Data Processing:
The objective “to develop and validate new algorithms relevant for coral reef monitoring based on Sentinel-2 observations” will be addressed by parameterizing existing models for processing hyper-spectral & multi-spectral data and developing pre-processors for these models to build Sentinel-2 data processing algorithms for the retrieval of coral reefs’ static and dynamic characteristics. The code developed will be made available open source.
Validation and uncertainty analysis will involve both comparing Sentinel MSI performance versus Landsat-8 on coral reef mapping objectives and comparing coral reef monitoring products against in situ data from reef sites representative of different composition and structure.
Product Development:
To design, verify and validate three coral reef monitoring products making the best use of Sentinel-2 MSI mission characteristics:
• Habitat mapping of coral reefs
• Coral reef change detection
• Bathymetry over coral reefs.
Field Campaign:
A 6 day field campaign around the South Pacific island of Fatu Huku was undertaken by French scientist Antoine Collin to collect in-situ data to test and validate the capabilities of the Sentinel-2 satellite to monitor coral reef bleaching.
Fatu Huku Island in French Polynesia was chosen as the survey site because of the presence of developed coral reefs and it is an area water temperatures are high as a result of the current El Niño event. During the survey, water temperature exceeding 30°C were recorded and coral bleaching, the expulsion of the symbiotic algae that provide energy from sunlight to the coral, was observed to be taking place.
Data collected from this field campaign complements archives of in-situ data collected over previous years from coral reef sites across the globe such as at Heron Island and Lizard Island, in Australia, and reefs around Palau, in the western Pacific Ocean.
1) P. Martimort, O. Arino, M. Berger, R. Biasutti, B. Carnicero, U. Del Bello, V. Fernandez, F. Gascon, B. Greco, P. Silvestrin, F. Spoto, O. Sy, “Sentinel-2 Optical High Resolution Mission for GMES Operational Services,” Proceedings of IGARSS 2007 (International Geoscience and Remote Sensing Symposium), Barcelona, Spain, July 23-27, 2007
2) P. Martimort, F. Spoto, B. Koetz, O. Arino, M. Rast, “GMES Sentinel-2, The Optical High Resolution Mission for GMES Operational Services,” July 16, 2007, URL: http://www.earthobservations.org/documents/cop/ag_gams/200707_01/gmes_sentinel2.pdf
3) ESA Sentinel-2 Team, “GMES Sentinel-2 Mission Requirements Document,” Issue 2, Revision 1, 08.03.2010, URL: http://esamultimedia.esa.int/docs/GMES/Sentinel-2_MRD.pdf
4) F. Spoto, M. Berger, “Sentinel-2 Presentation,” March 7-8, 2007, ESA/ESRIN, URL: http://esamultimedia.esa.int/docs/GMES/ESA/4_coloc_GMES_S2_GSC_day_7_8_March_2007.pdf
5) P. Martimort, M. Berger, B. Carnicero, U. Del Bello, V. Fernandez, F. Gascon, P. Silvestrin, F. Spoto, Omar Sy, O. Arino, R. Biasutti, B. Greco, “Sentinel-2 : The Optical High Resolution Mission for GMES Operational Services,” ESA Bulletin, No 131, Aug. 2007, pp. 19-23, URL: http://www.esa.int/esapub/bulletin/bulletin131/bul131b_martimort.pdf
6) Philippe Martimort, “The Optical High Resolution Mission The for GMES Operational Services for Services,” GMES Sentinel-2, AGRISAR Workshop, Noordwijk, The Netherlands, Oct. 15-16, 2007, URL: http://www.dlr.de/hr/Portaldata/32/Resources/
dokumente/agrisar/(03)_GMES_S2_Presentation_AGRISAR.pdf
7) F. Spoto, P. Martimort, O. Sy, P. Bargellini, B. Greco, “Sentinel-2: the European operational fast revisit high resolution land observing mission,” Sentinel-2: the European operational fast revisit high resolution land observing mission
8) François Spoto, Philippe Martimort, Omar Sy, Paolo Laberinti, Stefane Carlier, Umberto Del Bello, Valérie Fernandez, Volker Kirschner, Claudia Isola, Matthias Drusch, Pier Bargellini, Franco Marchese, Olivier Colin, Ferran Gascon, Bianca Hoersch, Aimé Meygret, “The GMES Sentinel-2 Operational Mission,” Proceedings of the ESA Living Planet Symposium, SP-686, Bergen Norway, June 28-July 2, 2010
9) “Copernicus: new name for European Earth Observation Programme,” European Commission Press Release, Dec. 12, 2012, URL: http://europa.eu/rapid/press-release_IP-12-1345_en.htm
10) ESA’s Sentinel-2 team, “Color Vision for Copernicus, The story of Sentinel-2,” ESA Bulletin No 161, May 11, 2015, pp. 2-9, URL: http://esamultimedia.esa.int
/multimedia/publications/ESA-Bulletin-161/offline/download.pdf
11) “GMES Sentinel-2 satellite contract signed,” April 17, 2008, URL: http://www.esa.int/esaEO/SEMH574XQEF_index_0.html
12) GMES Sentinel-2 Industry Day, Nov. 26, 2007, URL: http://esamultimedia.esa.int
/docs/industry/Sentinel/Nov07/Sentinel-2-Industry-Day-Nov-07-Astrium-VGs.pdf
13) http://www.astrium.eads.net/media/document/sentinel_2_data_sheet.pdf
14) Francois Spoto, Omar Sy, Paolo Laberinti, Philippe Martimort, Valerie Fernandez, Olivier Colin, Bianca Hoersch, Aime Meygret, “Overview of Sentinel-2,” Proceedings of IGARSS (International Geoscience and Remote Sensing Symposium), Munich, Germany, July 22-27, 2012
15) “Astrium to build ESA's second Sentinel-2 satellite for GMES,” March 31, 2010, URL: http://www.esa.int/esaLP/SEME2GIK97G_LPgmes_0.html
16) http://www.esa.int/Our_Activities/Observing_the_Earth/Copernicus/Sentinel-2
17) “Sentinel-2 — The Operational Copernicus Optical High Resolution Land Mission,” ESA, URL: http://esamultimedia.esa.int/docs/S2-Data_Sheet.pdf
18) S. Winkler, G. Wiedermann, W. Gockel, “High-Accuracy On-Board Attitude Estimation for the GMES Sentinel-2 Satellite: Concept, Design, and First Results,” AIAA Guidance, Navigation and Control Conference and Exhibit, August 18-21, 2008, Honolulu, Hawaii, USA, AIAA 2008-7482
19) ”CORECI An integrated COmpression REcording and CIphering solution for earth observation satellites,” 2014, Airbus DS, URL: http://www.space-airbusds.com/media/document/ens_4_coreci_2014_bd.pdf
20) ”Compression Recording Ciphering Unit,” Airbus DS, URL: http://www.space-airbusds.com/
en/equipment/coreci-an-integrated-compression-recording-and-ciphering-solution-for-earth.html
21) ”Launcher build-up is complete for Arianespace’s Vega mission with Sentinel-2B on March 6,” Arianespace, 27 Feb. 2017, URL: http://www.arianespace.com/mission-update/
launcher-build-up-is-complete-for-arianespaces-vega-mission-with-sentinel-2b-on-march-6/
22) ”Revealing Sentinel-2B,” ESA, Jan. 12, 2017, URL: http://m.esa.int/spaceinimages/Images/2017/01/Revealing_Sentinel-2B
23) ”Copernicus' Second Eye is ready to meet its Launcher,” Airbus DS, Nov. 15, 2016, URL: https://airbusdefenceandspace.com/newsroom/
news-and-features/copernicus-second-eye-is-ready-to-meet-its-launcher/
24) ”Airbus Defence and Space completes second Copernicus "Eye",”Airbus DS Press Release, June 15, 2016, URL: https://airbusdefenceandspace.com/newsroom/
news-and-features/airbus-defence-and-space-completes-second-copernicus-eye/
25)//directory.eoportal.org/web/eoportal/satellite-missions/c-missions/copernicus-sentinel-2#t@7GL1197Herb" style="color: rgb(0, 155, 207);"> “Processing begins with the Sentinel-2A payload for Arianespace's Vega launch in June,” Arianespace, April 27, 2015, URL: http://www.arianespace.com/news-mission-update/2015/1287.asp
26) “Preparing to launch 'color vision' satellite,” ESA, April 23, 2015, URL: http://www.esa.int/Our_Activities/Observing_the_Earth/
Copernicus/Sentinel-2/Preparing_to_launch_colour_vision_satellite
27) “Last stretch before being packed tight,” ESA, April 8, 2015, URL: http://www.esa.int
/Our_Activities/Observing_the_Earth/Copernicus/Last_stretch_before_being_packed_tight
28) “Last look at Sentinel-2A,” ESA, Feb. 24, 2015, URL: http://www.esa.int/Our_Activities/Observing_the_Earth/Copernicus/Last_look_at_Sentinel-2A
29) “Airbus Defence and Space delivers Sentinel-2A environmental monitoring satellite for testing,” Airbus DS Press Release, Aug. 21, 2014, URL: http://www.space-airbusds.com/en/press_centre
/airbus-defence-and-space-delivers-sentinel-2a-environmental-monitoring.html
30) “Bringing Sentinel-2 into focus,” ESA, May 28, 2014, URL: http://www.esa.int/Our_Activities/Observing_the_Earth/Copernicus/Bringing_Sentinel-2_into_focus
31)//directory.eoportal.org/web/eoportal/satellite-missions/c-missions/copernicus-sentinel-2#I@HlK1309Herb" style="color: rgb(0, 155, 207);"> “Sentinel-2,” ESA Bulletin, No 160, November 2014, p. 76
32) “Second Copernicus environmental satellite safely in orbit,” ESA, June 23, 2015, URL: http://www.esa.int/Our_Activities/Observing_the_Earth/Copernicus/
Sentinel-2/Second_Copernicus_environmental_satellite_safely_in_orbit
33) “Arianespace orbits second satellite in Copernicus system, Sentinel-2A, on fifth Vega launch,” Arianespace Press Release, June 22, 2015, URL: http://www.arianespace.com/news-press-release/2015/6-22-2015-VV05-launch-success.asp
34) Robert Lange, Frank Heine, Hartmut Kämpfer, Rolf Meyer, "High Data Rate Optical Inter-Satellite Links," 35th ECOC (European Conference on Optical Communication) Sept. 20-24, 2009, Vienna, Austria
35) “ESA and DLR pave the way for fast data transmission from space,” ESA, Oct. 21, 2010, URL: http://www.esa.int/esaEO/SEMYP0ZOBFG_index_0.html
36) ”Second ‘color vision’ satellite for Copernicus launched,” ESA, March 7, 2017, URL: http://m.esa.int/Our_Activities/Observing_the_Earth/
Copernicus/Sentinel-2/Second_colour_vision_satellite_for_Copernicus_launched
37) ”Another 'guardian' of the European Earth observation programme Copernicus is in orbit - Earth firmly in view – Sentinel-2B satellite successfully launched,” DLR, =7 March 2017, URL: http://www.dlr.de
/dlr/en/desktopdefault.aspx/tabid-10081/151_read-21504/year-all/#/gallery/26470
38) ”Airbus: Successfully launched Sentinel-2B to complete Europe´s colour vision mission of Earth,” Airbus DS, March 7, 2017, URL: https://airbusdefenceandspace.com/newsroom/news-and-features/
airbus-successfully-launched-sentinel-2b-to-complete-europes-colour-vision-mission-of-earth/
39) ”Sentinel-2B launch preparations off to a flying start,” ESA, January 12, 2017, URL: http://m.esa.int/Our_Activities/Observing_the_Earth/
Copernicus/Sentinel-2/Sentinel-2B_launch_preparations_off_to_a_flying_start
40) ”Earth from Space: Laizhou Bay,” ESA Applications, 23 April 2021, URL: https://www.esa.int/Applications/Observing_the_Earth/Earth_from_Space_Laizhou_Bay
41) ”La Soufrière volcano: before-and-after,” ESA Applications, 16 April 2021, URL: https://www.esa.int/ESA_Multimedia/Images/2021/04/La_Soufriere_volcano_before-and-after
42) ”Earth from Space: Space Coast, Florida,” ESA Applications, 16 April 2021, URL: https://www.esa.int/Applications/Observing_the_Earth/Earth_from_Space_Space_Coast_Florida
43) ”Earth from Space: Bucharest, Romania,” ESA Applications, 09 April 2021, URL: https://www.esa.int/Applications/Observing_the_Earth/Earth_from_Space_Bucharest_Romania
44) ”Satellites monitor Mount Etna’s unpredictable behaviour,” ESA Applications, 08 April 2021, URL: https://www.esa.int/Applications/Observing_the_Earth/
Satellites_monitor_Mount_Etna_s_unpredictable_behaviour
45) ”Measuring shoreline retreat,” ESA Applications, 29 March 2021, URL: https://www.esa.int
/Applications/Observing_the_Earth/Space_for_our_climate/Measuring_shoreline_retreat
46) ”Earth from Space: Gariep Dam, South Africa,” ESA Applications, 26 March, 2021, URL: https://www.esa.int/Applications/Observing_the_Earth/Earth_from_Space_Gariep_Dam_South_Africa
47) ”How ESA helps South Africa share water fairly,” ESA / Applications / Telecommunications & Integrated Applications, 22 March 2021, URL: https://www.esa.int/Applications/
Telecommunications_Integrated_Applications/How_ESA_helps_South_Africa_share_water_fairly
48) ”Earth from Space: Amazon rainforest,” ESA Applications, 19 March 2021, URL: https://www.esa.int/Applications/Observing_the_Earth/Earth_from_Space_Amazon_rainforest
49) ”Earth from Space: Strait of Gibraltar,” ESA Applications, 12 March 2021, URL: https://www.esa.int/Applications/Observing_the_Earth/Earth_from_Space_Strait_of_Gibraltar
50) ”Earth from Space: Galápagos Islands,” ESA Applications, 5 March 2021, URL: https://www.esa.int/Applications/Observing_the_Earth/Earth_from_Space_Galapagos_Islands2
51) ”Earth from Space: Vancouver,” ESA Applications, 26 February 2021, URL: https://www.esa.int/Applications/Observing_the_Earth/Earth_from_Space_Vancouver
52) ”Etna erupts,” ESA Applications, 19 February 2021, URL: https://www.esa.int/ESA_Multimedia/Images/2021/02/Etna_erupts
53) ”Earth from Space: Lusaka, Zambia,” ESA Applications, 19 February 2021, URL: https://www.esa.int/Applications/Observing_the_Earth/Earth_from_Space_Lusaka_Zambia
54) ”Earth from Space: Valentine Island,” ESA Applications, 12 February 2021, URL: https://www.esa.int/Applications/Observing_the_Earth/Earth_from_Space_Valentine_Island
55)//directory.eoportal.org/web/eoportal/satellite-missions/c-missions/copernicus-sentinel-2#@8H7W13bcHerb" style="color: rgb(0, 155, 207);"> ”Earth from Space: Japan in bloom,” ESA Applications, 5 February 2021, URL: https://www.esa.int/Applications/Observing_the_Earth/Earth_from_Space_Japan_in_bloom
56) ”Lake Titicaca,” ESA Applications, 29 January, 2021, URL: https://www.esa.int/Applications/Observing_the_Earth/Earth_from_Space_Lake_Titicaca
57) ”Sardinia, Italy,” ESA Applications, 22 January 2021, URL: https://www.esa.int/ESA_Multimedia/Images/2021/01/Sardinia_Italy
58) ”Tanezrouft Basin,” ESA Applications, 15 January 2021, URL: https://www.esa.int/ESA_Multimedia/Images/2021/01/Tanezrouft_Basin
59)//directory.eoportal.org/web/eoportal/satellite-missions/c-missions/copernicus-sentinel-2#bhP@V1ceHerb" style="color: rgb(0, 155, 207);"> ”Madrid snowbound,” ESA Applications, 12 January 2021, URL: https://www.esa.int/ESA_Multimedia/Images/2021/01/Madrid_snowbound
60) ”Kyiv, Ukraine,” ESA Applications, 11 December 2020, URL: https://www.esa.int/ESA_Multimedia/Images/2020/12/Kyiv_Ukraine
61) ”Banks Peninsula, New Zealand,” ESA Applications, 4 December 2020, URL: https://www.esa.int/ESA_Multimedia/Images/2020/12/Banks_Peninsula_New_Zealand
62) ”Kiruna, Sweden,” ESA Applications, 27 November 2020, URL: https://www.esa.int/ESA_Multimedia/Images/2020/11/Kiruna_Sweden
63) ”Vandenberg Air Force Base, California,” ESA Applications, 20 November 2020, URL: https://www.esa.int/Applications/Observing_the_Earth/Copernicus/Sentinel-2
64) ”Darmstadt, Germany,” ESA Applications, 13 November 2020, URL: https://www.esa.int/ESA_Multimedia/Images/2020/11/Darmstadt_Germany
65) ”Sentinel data enables new system for agricultural monitoring in Poland,” ESA Applications, 12 November 2020, URL: https://www.esa.int/Applications/Observing_the_Earth/
Copernicus/Sentinel_data_enables_new_system_for_agricultural_monitoring_in_Poland
66) ”Zeeland, Netherlands,” ESA Applications, 16 October 2020, URL: https://www.esa.int/ESA_Multimedia/Images/2020/10/Zeeland_Netherlands
67) ”Laguna San Rafael National Park, Chile,” ESA Applications, 9 October 2020, URL: https://www.esa.int/ESA_Multimedia/Images/2020/10/Laguna_San_Rafael_National_Park_Chile
68) ”New York City,” ESA Applications, 2 October 2020, URL: https://www.esa.int/ESA_Multimedia/Images/2020/10/New_York_City
69) Tarawa, Kiribati,” ESA Applications, 25 September 2020, URL: https://www.esa.int/ESA_Multimedia/Images/2020/09/Tarawa_Kiribati
70) ”Vatnajökull, Iceland,” ESA Applications, 18 September 2020, URL: https://www.esa.int/ESA_Multimedia/Images/2020/09/Vatnajoekull_Iceland
71) ”Satellite data help climbers ascend Mount Everest,” ESA Applications, 17 September 2020, URL: https://www.esa.int/ESA_Multimedia/Images/2020/09/Satellite_data_help_climbers_ascend_Mount_Everest
72) ”Copernicus Sentinel-2 monitors glacier icefall, helping climbers ascend Mount Everest,” ESA News, 17 September 2020, URL: https://sentinels.copernicus.eu/web/sentinel/news/-/
article/copernicus-sentinel-2-monitors-glacier-icefall-helping-climbers-ascend-mount-everest
73) Bas Altena and Andreas Kääb, ”Ensemble matching of repeat satellite images applied to measure fast-changing ice flow, verified with mountain climber trajectories on Khumbu icefall, Mount Everest,” Journal of Glaciology, Published: 11 August 2020, https://doi.org/10.1017/jog.2020.66, URL: https://tinyurl.com/yy8tkwrj
74) ”Spalte breaks up,” ESA Applications, 15 September 2020, URL: https://www.esa.int/ESA_Multimedia/Images/2020/09/Spalte_breaks_up
75) ”Gulf of Kutch, India,” ESA Applications, 04 September 2020, URL: https://www.esa.int/ESA_Multimedia/Images/2020/09/Gulf_of_Kutch_India
76) ”Mauritius oil spill,” ESA Applications, 11 August 2020, URL: https://www.esa.int/ESA_Multimedia/Images/2020/08/Mauritius_oil_spill
77) ”Discovering new penguin colonies from space,” ESA Applications, 05 August 2020, URL: https://www.esa.int/Applications/Observing_the_Earth/
Copernicus/Sentinel-2/Discovering_new_penguin_colonies_from_space
78) Peter T. Fretwell, Philip N. Trathan, ”Discovery of new colonies by Sentinel2 reveals good and bad news for emperor penguins,”Remote Sensing in Ecology and Conservation, https://doi.org/10.1002/rse2.176, Published: 04 August 2020, URL: https://zslpublications.onlinelibrary.wiley.com/doi/epdf/10.1002/rse2.176
79) ”Flinders Ranges, South Australia,” ESA Applications, 31 July 2020, URL: https://www.esa.int/ESA_Multimedia/Images/2020/07/Flinders_Ranges_South_Australia
80) ”Utah's Great Salt Lake,” ESA Applications, 17 July 2020, URL: https://www.esa.int/ESA_Multimedia/Images/2020/07/Utah_s_Great_Salt_Lake
81)//directory.eoportal.org/web/eoportal/satellite-missions/c-missions/copernicus-sentinel-2#jKp@U11d2Herb" style="color: rgb(0, 155, 207);"> ”Ari Atoll, Maldives,” ESA Applications, 3 July 2020, URL: https://www.esa.int/ESA_Multimedia/Images/2020/07/Ari_Atoll_Maldives
82) ”Roter Kamm impact crater,” ESA Applications, 30 June 2020, URL: http://www.esa.int/ESA_Multimedia/Images/2020/06/Roter_Kamm_impact_crater
83) ”Peruvian Andes,” ESA Applications, 26 June 2020, URL: http://www.esa.int/ESA_Multimedia/Images/2020/06/Peruvian_Andes
84) ”Great Rift Valley, Kenya,” ESA Applications, 19 June 2020, URL: http://www.esa.int/ESA_Multimedia/Images/2020/06/Great_Rift_Valley_Kenya
85) ”Barcelona, Spain,” ESA Applications, 12 June 2020, URL: http://www.esa.int/ESA_Multimedia/Images/2020/06/Barcelona_Spain
86) ”Parking in a pandemic,” ESA Applications, 9 June 2020, URL: http://www.esa.int/Applications/Observing_the_Earth/Copernicus/Sentinel-2/Parking_in_a_pandemic
87)//directory.eoportal.org/web/eoportal/satellite-missions/c-missions/copernicus-sentinel-2#J@UsU12efHerb" style="color: rgb(0, 155, 207);"> ”Arctic Circle oil spill,” ESA Applications, 5 June 2020, URL: http://www.esa.int/ESA_Multimedia/Images/2020/06/Arctic_Circle_oil_spill
88) ”Colorful Queensland, Australia,” ESA Applications, 5 June 2020, URL: https://www.esa.int/ESA_Multimedia/Images/2020/06/Colourful_Queensland_Australia
89) ”Abu Dhabi,” ESA Application, 29 May 2020, URL: http://www.esa.int/ESA_Multimedia/Images/2020/05/Abu_Dhabi
90) ”Ice jam flooding in Fort McMurray,” ESA Applications, 28 May 2020, URL: http://www.esa.int/ESA_Multimedia/Images/2020/05/Ice_jam_flooding_in_Fort_McMurray
91) ”Atacama minerals,” ESA Applications, 22 May 2020, URL: http://www.esa.int/ESA_Multimedia/Images/2020/05/Atacama_minerals
92) ”San Francisco Bay,” ESA Applications, 15 May 2020, URL: http://www.esa.int/ESA_Multimedia/Images/2020/05/San_Francisco_Bay
93) ”Southern Ukraine,” ESA Applications, 01 May 2020, URL: http://www.esa.int/ESA_Multimedia/Images/2020/05/Southern_Ukraine
94) ”Namib Desert,” ESA Applications, 24 April 2020, URL: http://www.esa.int/ESA_Multimedia/Images/2020/04/Namib_Desert
95) ”Dutch tulip fields come into bloom,” ESA Applications, 23 April 2020, URL: http://www.esa.int/ESA_Multimedia/Images/2020/04/Dutch_tulip_fields_come_into_bloom
96) ”Montevideo, Uruguay,” ESA Applications, 17 April 2020, URL: http://www.esa.int/ESA_Multimedia/Images/2020/04/Montevideo_Uruguay
97) ”Mapping Chernobyl fires from space,” ESA / Applications / Observing the Earth / Copernicus / Sentinel-2, 16 April 2020, URL: http://www.esa.int/Applications/Observing_the_Earth
/Copernicus/Sentinel-2/Mapping_Chernobyl_fires_from_space
98) ”Deserted Venetian lagoon,” ESA Applications, 14 April 2020, URL: http://www.esa.int/ESA_Multimedia/Images/2020/04/Deserted_Venetian_lagoon
99) ”Earth from Space: Wheatbelt, Western Australia,” ESA Applications, 10 April 2020, URL: http://www.esa.int/ESA_Multimedia/Images/2020/04/Wheatbelt_Western_Australia
100) ”Finistère, France,” ESA Applications, 03 April 2020, URL: http://www.esa.int/ESA_Multimedia/Images/2020/04/Finistere_France
101)//directory.eoportal.org/web/eoportal/satellite-missions/c-missions/copernicus-sentinel-2#T@BTU1165Herb" style="color: rgb(0, 155, 207);"> ”Land-cover maps of Europe from the Cloud,” ESA / Applications / Observing the Earth / Copernicus / Sentinel-2, 20 March 2020, URL: http://www.esa.int/Applications/Observing_the_Earth
/Copernicus/Sentinel-2/Land-cover_maps_of_Europe_from_the_Cloud
102) ”Kuwait,” ESA Applications, 20 March 2020, URL: http://www.esa.int/ESA_Multimedia/Images/2020/03/Kuwait
103) ”Victoria Falls,” ESA Applications, 13 March 2020, URL: http://www.esa.int/ESA_Multimedia/Images/2020/03/Victoria_Falls
104) ”Burned area trends in the Amazon similar to previous years,” ESA / Applications / Observing the Earth, 06 March 2020, URL: http://www.esa.int/Applications/Observing_the_Earth
/Burned_area_trends_in_the_Amazon_similar_to_previous_years
105) Joshua Lizundia-Loiola, M. Lucrecia Pettinari and Emilio Chuvieco, ” Temporal Anomalies in Burned Area Trends: Satellite Estimations of the Amazonian 2019 Fire Crisis,” Remote Sensing Letter, Vol. 12, No 1, Published: 2 January 2020, https://doi.org/10.3390/rs12010151
106) ”Let it snow,” ESA Applications, 4 March 2020, URL: http://www.esa.int/ESA_Multimedia/Images/2020/03/Let_it_snow
107) “Andros, Bahamas,” ESA Applications, 28 February 2020, URL: http://www.esa.int/ESA_Multimedia/Images/2020/02/Andros_Bahamas
108) “Bolivian highland heart,” ESA Applications, 14 February 2020, URL: http://www.esa.int/ESA_Multimedia/Images/2020/02/Bolivian_highland_heart
109) „Iceberg shattered,“ ESA Applications, 12 February 2020, URL: http://www.esa.int/ESA_Multimedia/Images/2020/02/Iceberg_shattered
110)//directory.eoportal.org/web/eoportal/satellite-missions/c-missions/copernicus-sentinel-2#DP@CU11c0Herb" style="color: rgb(0, 155, 207);"> ”Lake George, Uganda,” ESA Applications, 31 January 2020, URL: https://www.esa.int/ESA_Multimedia/Images/2020/01/Lake_George_Uganda
111) ”Deforestation in Bolivia,” ESA Applications, 24 January 2020, URL: http://www.esa.int/ESA_Multimedia/Images/2020/01/Deforestation_in_Bolivia
112) ”Taal volcano blanketed by ash,” ESA Applications, 23 January 2020, URL: http://www.esa.int/ESA_Multimedia/Images/2020/01/Taal_volcano_blanketed_by_ash
113) ”Flooding in southern Iran,” ESA Applications, 15 January 2020, URL: http://www.esa.int/ESA_Multimedia/Images/2020/01/Flooding_in_southern_Iran
114) ”Faroe Islands,” ESA Applications, 10 January 2020, URL: https://www.esa.int/ESA_Multimedia/Images/2020/01/Faroe_Islands
115) ”Smoke and flames in Australia,” ESA Applications, 9 January 2020, URL: http://www.esa.int/Applications/Observing_the_Earth/Copernicus/Australia_like_a_furnace
116) Vincent Cazaubiel, Vincent Chorvalli, Christophe Miesch, “The Multispectral Instrument of the Sentinel-2 Program,” Proceedings of the 7th ICSO (International Conference on Space Optics) 2008, Toulouse, France, Oct. 14-17, 2008
117) Michel Bréart de Boisanger, Olivier Saint-Pé, Franck Larnaudie, Saiprasad Guiry, Pierre Magnan, Philippe Martin Gonthier, Franck Corbière, Nicolas Huger, Neil Guyatt, “COBRA, a CMOS Space Qualified Detector Family Covering the Need for many LEO and GEO Optical Instruments,” Proceedings of the 7th ICSO (International Conference on Space Optics) 2008, Toulouse, France, Oct. 14-17, 2008
118) François Spoto , Philippe Martimort, Omar Sy, Paolo Laberinti, “Sentinel-2, Optical High Resolution Mission for GMES Operational services,” Sentinel-2 Preparatory Symposium, ESA/ESRIN, Frascati, Italy, April 23-27, 2012, URL: http://www.s2symposium.org/
119) Vincent Chorvalli, Stéphane Espuche, Francis Delbru, Cornelius Haas, Philippe Martimort, Valérie Fernandez, Volker Kirchner, “The Multispectral Instrument of the Sentinel-2 Em Program Results,” Proceedings of the ICSO (International Conference on Space Optics),Ajaccio, Corse, France, Oct. 9-12, 2012, paper: ICSO-023, URL: http://congrex.nl/icso/2012/papers/FP_ICSO-023.pdf
120) S. Espuche, V. Chorvalli, A. Laborie, F. Delbru, S. Thomas, J. Sagne, C. Haas, P. Martimort, V. Fernandez, V. Kirchner, “VNIR focal plane results from the multispectral instrument of the Sentinel-2 mission,” Proceedings of the ICSO (International Conference on Space Optics), Tenerife, Canary Islands, Spain, Oct. 7-10, 2014, URL: http://congrexprojects.com/Custom/ICSO/2014/Papers/1.%20Tuesday%207%20October
/Session%203A%20Detectors%20for%20Visible%20ROIC/2.74651_Espuche.pdf
121) “Sentinel-2 MSI Introduction,” ESA User Guide, URL: https://earth.esa.int
/web/sentinel/user-guides/sentinel-2-msi
122) “Sentinel-2 MSI Technical Introduction,” ESA, URL: https://earth.esa.int
/web/sentinel/sentinel-2-msi-wiki/-/wiki/Sentinel%20Two/What+is+Sentinel+Two
123) Jean-Loup Bezy, “Optical Instruments in ESA’s Earth Observation Missions,” Proceedings of the ICSO (International Conference on Space Optics), Tenerife, Canary Islands, Spain, Oct. 7-10, 2014, URL: http://congrexprojects.com/Custom/ICSO/2014/Presentations/01%20Plenary%20Room
/Session%201/1.%20Optical%20Instruments%20in%20ESAs%20
Earth%20Observations%20Missions,%20Jean-Loup%20Bezy.pdf
124) Michel Bougoin, Jerome Lavenac, “The SiC hardware of the Sentinel-2 Multi Spectral Instrument,” Proceedings of the ICSO (International Conference on Space Optics), Ajaccio, Corse, France, Oct. 9-12, 2012, paper: ICSO-028, URL: http://congrex.nl/icso/2012/papers/FP_ICSO-028.pdf
125) P. Gloesener, F. Wolfs, F. Lemagne, C. Flebus, “Manufacturing, testing and alignment of Sentinel-2 MSI telescope mirrors,” Proceedings of the ICSO (International Conference on Space Optics), Ajaccio, Corse, France, Oct. 9-12, 2012 , paper: ICSO-034, URL: http://congrex.nl/icso/2012/papers/FP_ICSO-034.pdf
126) Karin Schröter, Uwe Schallenberg, Matthias Mohaupt, “Technological Development of Spectral Filters for Sentinel-2,” Proceedings of the 7th ICSO (International Conference on Space Optics) 2008, Toulouse, France, Oct. 14-17, 2008
127) J. A. Andion, X. Olaskoaga, “Sentinel-2 Multispectral Instrument Calibration and Shutter Mechanism,” Proceedings of the 14th European Space Mechanisms & Tribology Symposium – ESMATS 2011, Constance, Germany, Sept. 28–30 2011 (ESA SP-698)
128)//directory.eoportal.org/web/eoportal/satellite-missions/c-missions/copernicus-sentinel-2#@cIJE17dHerb" style="color: rgb(0, 155, 207);"> M. Staehle, M. Cassel, U. Lonsdorfer l, F. Gliem, D. Walter, T. Fichna, “Sentinel 2 MMFU: The first European Mass Memory System Based on NAND-Flash Storage Technology,” Proceedings of the DASIA (DAta Systems In Aerospace) 2011 Conference, San Anton, Malta, May 17-20, 2011, ESA SP-694, August 2011
129) M. Staehle, M. Cassel, U. Lonsdorfer, F. Gliem, D. Walter, T. Fichna, “Sentinel-2 MMFU: The first European Mass Memory System based on NAND-Flash Storage Technology,” Proceedings of ReSpace/MAPLD 2011, Aug. 22-25, 2011, Albuquerque, NM, USA, URL: https://nepp.nasa.gov/respace_mapld11/talks/thu/ReSpace_C/1030%20-%20Cassel.pdf
130) Giuseppe Mandorlo, “Sentinel-2 Mass Memory and Formatting Unit and Future File Based Operations,” Proceedings of ADCSS (Avionics Data, Control and Software Systems) Workshop, ESA/ESTEC, Noordwijk, The Netherlands, Oct.23-25, 2012, URL: http://congrexprojects.com/docs/12c25_2510/06mandorlo_mmfufileops.pdf?sfvrsn=2
131) Michael Stähle, Tim Pike, “ADCSS 2012 Astrium - Current and Future Mass Memory Products,” Proceedings of ADCSS (Avionics Data, Control and Software Systems) Workshop, ESA/ESTEC, Noordwijk, The Netherlands, Oct.23-25, 2012, URL: http://congrexprojects.com/docs/12c25_2510/09stahele_astriumfinal.pdf?sfvrsn=2
132) Olivier Colin, “Sentinel-2 Payload Data Ground Segment,” Sentinel-2 Preparatory Symposium, Frascati, Italy, ESA/ESRIN, April 23-27, 2012, URL: http://www.s2symposium.org/
133)//directory.eoportal.org/web/eoportal/satellite-missions/c-missions/copernicus-sentinel-2#TyB@B1cbHerb" style="color: rgb(0, 155, 207);"> H. L. Moeller, S. Lokas, O. Sy, B. Seitz, P. Bargellini, “The GMES-Sentinels – System and Operations,” Proceedings of the SpaceOps 2010 Conference, Huntsville, ALA, USA, April 25-30, 2010, paper: AIAA 2010-2189
134) Henri Laur, “SAR Interferometry opportunities with the European Space Agency: ERS-1, ERS-2, Envisat, Sentinel-1A, Sentinel-1B, ESA 3rd Party Missions (ALOS),” Fringe 2009 Workshop - Advances in the Science and Applications of SAR Interferometry, Frascati, Italy, Nov. 30-Dec. 4, 2009
135) “ESA Member States approve full and open Sentinel data policy principles,” ESA, Nov. 27, 2009, URL: http://www.esa.int/esaEO/SEMXK570A2G_environment_0.html
136) Susanne Mecklenburg, “GMES Sentinel Data Policy - An overview,” GENESI-DR (Ground European Network for Earth Science Interoperations - Digital Repositories) workshop, ESAC, Villafranca, Spain, December 4, 2009
137) Bianca Hoersch, “GMES Space Component & Sentinel(-2),” Landsat Science Team Meeting, Mountain View, CA, USA, Jan. 19-21, 2010, URL: http://landsat.usgs.gov/documents/
Jan_2010_Landsat_Science_Team_meeting_Jan2010_Hoersch_Final-short.pdf
138) “EU: Sentinel data policy principles have been approved,” Dec. 18, 2009, URL: http://www.epractice.eu/en/news/300771
139) ”Sen2Coral,” URL: https://sen2coral.argans.co.uk/
140) John Hedley, Chris Roelfsema, Benjamin Koetz, Stuart Phinn (2012), “Capability of the Sentinel 2 mission for tropical coral reef mapping and coral bleaching detection”, Remote Sensing of the Environment, Vol. 120, pp: 145-155, 2012, URL : https://www.researchgate.net/publication/256850163_Capability
_of_the_Sentinel_2_mission_for_tropical_coral_reef_mapping_and_coral_bleaching_detection
The information compiled and edited in this article was provided by Herbert J. Kramer from his documentation of: ”Observation of the Earth and Its Environment: Survey of Missions and Sensors” (Springer Verlag) as well as many other sources after the publication of the 4th edition in 2002. - Comments and corrections to this article are always welcome for further updates ().


