MetOp-A is Europe's first polar-orbiting (LEO) satellite dedicated to operational meteorology. The MetOp program was originally planned as a much larger satellite concept, called POEM (Polar-Orbit Earth-Observation Mission), a successor mission series to ERS-1/2 on the Columbus Polar Platform (PPF design).
However, this idea was abandoned at the ESA Ministerial Council in Granada, Spain, in 1992. Instead, Envisat and MetOp were born. Full approval of the EPS (EUMETSAT Polar System) program was granted in September 1998. The MetOp program is planned as a series of three satellites to be launched sequentially over an observational period of 14 years, starting in 2006 with MetOp-A (2010, 2014), it represents the space segment of EPS. 1) 2)
|
The EUMETSAT Polar System (EPS) consists of the ESA-developed MetOp (Meteorological OPerational) series of spacecraft and an associated ground segment for meteorological and climate monitoring from polar, low Earth orbit, providing “morning” service for operational meteorology. Within the framework of international agreements, the NOAA POES series will continue to provide the “afternoon” service. The MetOp series, although an independent development, is complementary to: a) the NOAA POES system, b) the EUMETSAT/ESA MSG (Meteosat Second Generation) system, and c) the ESA ENVISAT system, where MetOp completes the mission objectives of the original POEM-1 mission. Background: European needs for meteorological observations in polar (“morning” and “afternoon”) orbits have been generously provided by NOAA S/C and payloads (including some instruments developed in Europe) over the last quarter century. The EPS (EUMETSAT Polar System) is the European contribution to the joint European/US operational polar system, through IJPS (Initial Joint Polar System). A cooperation agreement between NOAA and EUMETSAT was signed in November 1998. The EPS and POES systems form together the IJPS to provide global meteorological data from the series. With EPS, EUMETSAT is committed to take over the morning orbit service from NOAA. On the other hand, NOAA will continue to provide the POES series afternoon service. Both services are coordinated and integrated, on the basis of exchange of data, instruments and operational services The prime objectives of the EPS MetOp mission series are as follows: • To ensure continuity and availability for operational purposes of polar meteorological observations from the “morning” orbit to the global user community • To provide enhanced monitoring capabilities (complimentary to ENVISAT) to fulfil the requirements to study the Earth climate system as expressed in a number of international cooperative programs such as: GCOS (Global Climate Observing System), IGBP (International Geosphere and Biosphere Program), and WCRP (World Climate Research Program). The aim is to provide continuous, long-term data sets. EPS is an end-to-end system composed of a space segment and a full ground segment (see Figure 43). The third satellite in this series, MetOp-3, is not formally part of IJPS, because its planned launch date falls already into the era of the US NPOESS (National Polar-orbiting Operational Environmental Satellite System) era, representing in itself the merged US POES (civil) and DMSP (military) series. Within the European framework, ESA is developing MetOp-A, the EUMETSAT procurement of MetOp-2/3 missions is under the responsibility of a joint ESA/EUMETSAT team. EUMETSAT is also directly responsible for the delivery of the following payloads: MHS, IASI, Argos/ADCS, SEM, AMSU-A, HIRS/4, and AVHRR/3. The last four payloads are contributed by NOAA under the IJPS agreement: CNES develops the IASI instrument with joint funding from EUMETSAT, and provides the Argos/ADCS, and in addition, part of the S&RSAT (Search & Rescue) auxiliary payload. EUMETSAT is responsible for the definition of the overall EPS system, the development and operations of the ground segment, and for the operation of the space segment. |
Table 1: Overview of EPS (EUMETSAT Polar System)

Figure 1: Integrated concept of NOAA/EUMETSAT meteorological polar satellites
Naming convention of MetOp satellites (the information was provided by the head of the EUMETSAT spacecraft team on Oct. 31, 2006):
The various naming of the spacecraft is due to the way the program development evolved:
• MetOp-1 is the first flight unit built, MetOp-2 the second, MetOp-3 the third.
• Due to programmatic reasons at system level, a decision was taken to fly MetOp-2 first.
• In order to avoid confusion, for the purposes of operations, the MetOp-2 flight model is referred to operationally as MetOp-Asince it is the first satellite in-orbit. The international satellite designator of COSPAR is: 2006-044A, and a NORAD catalog ID is: 29499. The MetOp administration messages downlinked on HRPT/LRPT contains the COSPAR identifier (left-justified).

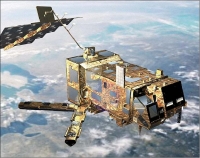
Figure 2: Artist's view of the MetOp-A spacecraft in orbit (image credit: ESA, EUMETSAT)
MetOp-A Satellite
The overall architecture of the MetOp-A spacecraft comprises two largely independent modules, namely SVM (Service Module) and PLM (Payload Module). 3) 4) 5) 6) 7)
• SVM provides the main satellite support/service functions. The SVM provides all the standard service functions of a S/C, like: attitude and orbit control, propulsion, power generation, and the on-board data handling and distribution systems. The SVM design is based on the SPOT MK3 bus (used on the SPOT series, ERS-1/2 and Helios-1A and 1B S/C). SVM is a box-shaped structure interfacing with the launch vehicle and the PLM as illustrated in Figure 4.
• PLM provides accommodation and supporting subsystems (data handling, power, communications) to the payload complement. The instruments and antennas are mounted on the external panels, while most of the electronics systems are accommodated inside the PLM.

Figure 3: Schematic view of the AOCS (image credit: ESA)
The S/C overall size is: 6.2 m x 3.4 m x 3.40 m (launch configuration) and 17.6 m x 6.7 m x 5.4 m (on-orbit configuration). The S/C is three-axis stabilized. The AOCS (Attitude and Orbit Control Subsystem) is in charge of the automatic 3-axes control of the satellite attitude, the orbit control for which the needed thrust impulses are provided by the propulsion subsystem. Attitude sensing is provided by digital Earth sensors for roll and pitch, by sun sensors for yaw, and by four independent two-axis gyros (two being in cold redundancy).
Actuation is provided by three 40 Nms reaction wheels, by two magnetotorquers (MAC) able to generate a 315 Am2 magnetic moment, and by the associated monitoring and command unit (EAIM). In addition, the propulsion subsystem works in blow-down mode; it includes four pressurized tanks of hydrazine. Two branches of eight 23.5 N thrusters are used. The pointing knowledge is: 0.07º (x-axis), 0.10º (y-axis), 0.17º (z-axis).
The overall S/C mass at launch is 4085 kg, including 316 kg of hydrazine. Single sided solar arrays provide a power of 3.890 kW (EOL), the average power over one orbit is 1.81 kW (EOL). Five 40 Ah batteries provide power during eclipse periods. The mission design life is 5 years. The prime S/C contractor is EADS Astrium SAS (France), major co-contractors are EADS Astrium GmbH, Germany (PLM), Alenia, Italy, and EADS Astrium Ltd., UK.

Figure 4: Schematic of the SVM (Service Module) configuration (image credit: ESA)

Figure 5: Exploded view of the main elements of SVM (image credit: ESA)

Figure 6: Schematic overview of the PLM (Payload Module) configuration (image credit: ESA)
|
Parameter |
Value |
Parameter |
Value |
|
Mass of SVM |
1380 kg |
Mass of solar array |
255 kg |
|
Mass of PLM |
1214 kg |
Mass of fuel |
316 kg |
|
Mass of payload |
920 kg |
Overall mass of S/C |
4085 kg |
|
Power of instruments |
885 W (average) |
Power of PLM |
491 W (average) |
|
Power SVM |
437 W (average) |
Total power consumption |
1.81 kW (average) |
Table 2: Overview of some key spacecraft parameters

Figure 7: Line drawing of the MetOp spacecraft (image credit: EADS Astrium)
RF communication: An omnidirectional S-band coverage provides TT&C support (uplink 2 kbit/s, downlink 4 kbit/s). Instrument data is downlinked in X-band at a rate of 70 Mbit/s. Onboard storage capacity of 24 Gbit (solid state recorder with a data rate of 70 Mbit/s) is provided. In addition to onboard recording and X-band downlink capabilities, MetOp supports the real-time broadcast of instrument data to local authorized users by the following means:
• LRPT (Low-Rate Picture Transmission) links with 72 kbit/s in VHF-band for selected instrument data.
• AHRPT (Advanced High-Rate Picture Transmission) links with 3.5 Mbit/s in L-band. The new AHRPT service (a WMO standard) enables regional users to receive all data relevant to their area in real time. Users operating existing HRPT stations will have to modify their stations to receive the “Advanced” MetOp data.
The provided VHF low-rate digital direct broadcast service replaces the old analog APT (Automatic Picture Transmission) service of NOAA, employing data compression (modified JPEG compression scheme) to ensure high-quality images. The digital LRPT service retains the VHF frequency and bandwidth of the APT service, but provides three channels of AVHRR data at the full instrument spatial and radiometric resolution.
|
Data Type |
Frequency Domain |
Modulation Scheme |
Data Rate |
|
TT&C uplink |
S-band, 2053.4 MHz |
NRZ/PSK/PM |
2 kbit/s |
|
TT&C downlink |
S-band, 2230 MHz |
SP-L/PSK/PM |
4 kbit/s |
|
Global data dump |
X-band, 7.750-7.900 GHz |
QPSK |
70 Mbit/s |
|
LRPT downlink |
VHF-band, 137.1 MHz |
QPSK |
72 kbit/s |
|
AHRPT downlink |
L-band, 1701.3 MHz |
QPSK |
3.5 Mbit/s |
Table 3: Summary of MetOp communication links with the ground segment
The EPS Ground Segment includes all the ground facilities required to support the orbiting MetOp satellites and the EPS mission, including both normal and degraded mission modes. Its objectives are:
• To ensure that the satellites perform their mission nominally
• To perform the ground operations to fulfil the global mission, acquiring and processing the global data received from the NOAA and MetOp satellites and disseminating the processed data to the Eumetsat member states. This includes product quality control, data archiving, and provision of user services.
• To perform all the ground operations to support the local data-access mission (HRPT/LRPT)
• To support NOAA for global data acquisition and telemetry, tracking and control during blind orbits of the NOAA ground segment (and on request for specific operations)
• To support the space environment monitoring and data-collection missions.
The core ground segment provides the following functions at the different sites:
• Central Site, at Eumetsat headquarters in Darmstadt, Germany, includes all the functions for monitoring and controlling the satellite and the ground segment. Included are the generation of the centrally extracted products and their dissemination.
• The Polar Site, at Svalbard (latitude 78ºN), hosts the CDA (Control & Data Acquisition) station that receives the MetOp recorder dump every orbit and command the satellite. The CDA receives also NOAA satellite data dumps when they are beyond their own stations.
• The BUCC (Back-Up Control Center) site, close to Madrid, Spain, was created in case of major problems with the central site.
The EPS ground segment includes the Eumetsat multi-mission dissemination system (EUMETCast) for near-realtime delivery to users of the global data and products derived from the MetOp data for the morning orbit and NOAA data for the afternoon orbit.
Onboard data handling: On the MetOp spacecraft command and control concept is implemented separately to measurement data handling. However, since this concept doesn't work for the NOAA-provided instruments (AVHRR/3, HIRS/4, AMSU-A, and SEM-2), a dedicated NIU (NOAA Interface Unit) has been developed to adapt the NOAA interfaces to European standards. The NIU performs command and control through a dedicated Instrument Control Unit (ICU) and collects measurement data through a DSP (Digital Signal Processor). It also compresses the AVHRR channels. To allow for selective encryption in the FMU (Formatting and Multiplexing Unit), the NIU provides measurement data to the FMU via four distinct data streams:
• NIU (NOAA Interface Unit)
• MHS (Microwave Humidity Sounder) Protocol conversion Unit (MPU)
• FMU
• SSR (Solid State Recorder)
General onboard data handling employs the CCSDS protocols. A selective encryption capability is used to ensure the commercial and data-denial needs of EUMETSAT and NOAA, respectively. Spacecraft operations are being performed by EUMETSAT with the Kiruna ground station serving as prime.

Figure 8: Overview of PLM measurement data acquisition, handling, and storage (image credit: ESA)
The PLM (Payload Module) command and control function is performed through:
• PMC (Payload Module Computer). The PMC controls all PLM equipment and instruments via an ESA standard OBDH (On Board Data Handling) bus.
• CBS (Standard Bus Couplers)
• RTU (Remote Terminal Units)
• DBU (Digital Bus Units)
• RBI (Standard Remote Bus Interface ASICs)
• ICU Intelligent Control Units)
The data handling architecture is decentralized because the Payload Module (PLM) and Service Module (SVM) have their own computer. OBDH data buses are being used for data exchanges between SVM and PLM computers.
Broadcast service provision: 8) The MetOp program, as successor to the NOAA POES morning series, is required to provide a continuous broadcast of its meteorological data to the worldwide user community, so that any ground station in any part of the world can receive local data when the satellite passes over that receiving station. This implies continued long-term provision of LRPT and VHF downlink services.
Orbit: Near-circular sun-synchronous polar morning orbit (local solar time at 9:30 hours on descending node), mean altitude = 817 km, inclination = 98.704º, repeat cycle = 29 days (412 orbits).
|
S/C attitude |
- Three-axis stabilized through reaction wheels |
|
Data handling |
- Instruments science data acquired as CCSDS packets |
|
Communications |
- Omnidirectional S-band coverage (uplink 2 kbit/s, downlink: 4.096 kbit/s |
|
On-board power |
- 2210 W from solar panel, average power over one orbit (EOL) |
|
Design life |
5 years |
|
S/C mass |
- 4087 kg (launch) |
|
S/C size |
- 6.3 m (height) by 2.5 m x 2.5 m (transverse section) in launch configuration |
|
S/C operations |
- S/C controlled by EUMETSAT (Kiruna ground station |
Table 4: Summary of MetOp main features and performances
The MetOp operational meteorological mission objectives consist of:
• Global sounding: To provide information about 3-D temperature and humidity fields in support of operational numerical forecasting systems
• Global imagery: To provide cloud imagery for forecasting applications, sea surface temperatures (SST), radiation budget temperatures. To support the global sounding mission through the identification of cloud-free areas
• Data collection and location: To support WWW objectives by the reception and dissemination of in-situ observations from ocean buoys and similar data collection platforms
• Preoperational data: To provide access to data from instruments which have not yet been declared fully operational
• Global data access: To primarily support global-scale weather forecasting by providing global data to the meteorological services within 2 1/4 hours of observation
• Local data access (AHRPT and LRPT): To support regional weather forecasting by providing broadcasted data to local receiving stations when the satellite is in visibility.
The MetOp climate monitoring mission contributions (for GCOS) consists of:
• Imagery and sounding
• Ocean measurements (including surfaces stress and winds)
• Clouds and Earth radiation budget: Radiation is the primary energy source of the climate system and principle heat input source to the oceans
• Sea ice information: The extent of sea ice is an important variable in connection with both ocean heat budget and radiation balance
• Atmospheric minor constituents: Concern over the depletion of stratospheric ozone suggests the importance of maintaining a continuous data set of global total column ozone and vertical profiles
• Precipitation estimates.
The MetOp Earth sciences research mission objectives include data provision to the European science community to advance investigations in fields such as:
• Atmospheric physics: chemistry, radiation and energy balance, clouds
• Oceanography: general ocean circulation and fluxes of heat, momentum and gases; modeling
• Hydrology: water cycle, continental snow and mountain glaciers, land cover, soil moisture, vegetation
• Cryosphere: sea ice, continental ice, modeling
The MetOp surveillance mission contributions to the regular monitoring of application-oriented parameters:
• Environment: pollution control, natural disasters, renewable resources
• Marine: offshore activities, ship routing, fishing, sea ice routing

Figure 9: Alternate view of the MetOp-A satellite configuration (image credit: ESA, EADS Astrium SAS)
Launch: MetOp-A was launched on a Soyuz-2-1A (Soyuz-2/Fregat) launch vehicle on October 19, 2006 from the Baikonur Cosmodrome, Kazakhstan. Launch provider: Starsem, a French-Russian company.
Launch: MetOp-B was launched on a Soyuz-2-1A (Soyuz-2/Fregat) launch vehicle on Sept. 17, 2012 from the Baikonur Cosmodrome, Kazakhstan. Launch provider: Starsem. 9)
Mission status of MetOp series S/C:
• On April 24, 2013, MetOp-B replaced MetOp-A as EUMETSAT’s prime operational polar-orbiting satellite following the end of its commissioning period. MetOp-A will continue operations as long as its available capacities bring benefits to users. 10)
- MetOp-B began delivering first data within two weeks of its launch, allowing expert users to participate in the product calibration and validation activities. The satellite was declared operational on 29 January, 2013, bringing operational quality products from most instruments to the user community within three months of launch.
• Feb. 8, 2013: Satellites show that the recent ozone hole over Antarctica was the smallest seen in the past decade. Long-term observations also reveal that Earth’s ozone has been strengthening following international agreements to protect this vital layer of the atmosphere. According to the ozone sensor on Europe’s MetOp weather satellite, the hole over Antarctica in 2012 was the smallest in the last 10 years. 11)
• On Oct. 24, 2012, the IASI instrument on Metop-B produced first calibrated data. 12)

Figure 10: First calibrated IASI spectrum on MetOp-B observed on Oct. 24, 2012 (image credit: EUMETSAT)
• Sept. 28, 2012: Four of the instruments on the Metop-B weather satellite (AMSU-A, ASCAT, MHS, GRAS) have been activated this week and are delivering data. After a commissioning phase of 6 months, MetOp-B is expected to replace the services of MetOp-A as prime operational spacecraft. 13)

Figure 11: First MetOp-B MHS data of orbit 110 on Sept. 25, 2012 over parts of Europe (image credit: ESA)
• On Sept. 20, 2012, EUMETSAT took control of Metop-B operations, following the three-day LEOP (Launch and Early Orbit Phase) conducted by the European Space Operations Centre (ESOC) of the European Space Agency (ESA). 14)
• The MetOp-A spacecraft is operating nominally in 2012 — with the known limitations/restrictions regarding the functions of LRPT, A-HRPT, and the AMSU-A1 channel 7. 15)
• On Oct. 19, 2011, the MetOp-A spacecraft completed its 5th year on orbit. All systems continue to perform excellently. 16)
• In June 2011, EUMETSAT declared ADA (Antarctic Data Acquisition) operational for MetOp-A. The EPS Ground System received next to Svalbard (Spitzbergen) a second ground station at McMurdo, Antartica due to long-term international partnership agreements of EUMETSAT, NOAA, NSF and NASA. Hence, MetOp -A became the first polar-orbiting environmental satellite to achieve the 65-minute data latency operationally (see ADA project description at end of this file). 17)
• In May 2011, after 4 ½ years of operation, the satellite is performing well. HRPT data transmission continues, but with restricted coverage area due to potential radiation issues; Eumetsat increased the coverage from January 2011. The assessment review and trend analysis shows that MetOp-A could operate for another six years or more, well beyond its design life. 18)
• MetOp-A is operating nominally in January 2011. The spacecraft completed its 4th year on orbit in October 2010. All instruments are performing excellently, with a few exceptions: Eumetsat discontinued the LRPT (Low Rate Picture Transmission) service in 2007 and AMSU-A1’s channel 7 was declared as failed in 2009. The A-HRPT data transmission continues in restricted coverage area due to radiation potential issues. 19)
- GOME-2 is operating well, although an investigation group has been set up to evaluate the in-orbit throughput degradation which could lead to some limitations in science data. MetOp-A deorbiting studies have started, planning for the first maneuvers around the MetOp-C launch date.
- Since its launch in 2006, the MetOp-A polar-orbiting satellite has helped transmit data from thousands of animals, oceanographic buoys, weather stations, and other platforms around the world with its on-board Argos-3 instrument. As of January 2011, there are over 20,000 active Argos transmitters on platforms ranging from high-tech oceanographic buoys and weather stations to the heads of elephant seals. Polar-orbiting satellites such as MetOp-A play their part in the Argos system by relaying the data they receive from Argos transmitters back down to earth for processing. 20) 21)

Figure 12: Transmitters developed by the University of St. Andrews (UK) are used to collect information from animals (image credit: EUMETSAT)
- On 18 January 2011, EUMETSAT commenced its extended AHRPT (Advanced High Resolution Picture Transmission) communication service. This enhancement effectively extends the geographical coverage of the AHRPT service to parts of Africa, Asia and the Pacific region where previously users were unable to receive the service. For the first time since the start of zone-based operations, transmissions will take place over ascending portions of the orbit, thereby further benefiting currently served geographic zones. Figure 13 indicates the new coverage zones for both descending and ascending passes. For spacecraft safety reasons, the service still maintains the same operational restrictions when passing over the polar regions and the SAA (South Atlantic Anomaly). 22)

Figure 13: MetOp-A switch-on zone - effective as of Jan. 18, 2011 as a pre-operational service (image credit: EUMETSAT)
• MetOp-A is operating nominally in 2010. All instruments continue to perform excellently in orbit. However, the HRPT-B system is transmitting in restrictive mode. 23)
- On Aug. 27, 2010, MetOp-A completed its 20,000th orbit delivering its data to the EUMETSAT Polar System ground station on Svalbard around lunchtime. 24)
• After more than three years in orbit, the IASI instrument shows very good functional health and very good performances. No symptom of degradation has been observed since launch. From a functional point of view, there is no use of redundancy and no hardware anomaly. - All functional anomalies have a SEU/SET origin. These SEU/SET (Single Event Upset/ Single Event Transient) anomalies had a small but non negligible impact on the instrument availability in the beginning of life. During the first years of operations, a significant number of SEU/SET events occurred mainly over the SAA (South Atlantic Anomaly) region and the polar regions. The consequences were mission outages lasting from a few hours to a few days. 25)
A fruitful cooperation between EUMETSAT, CNES and TAS allowed to implement different ways to minimize the IASI down time w.r.t. SEU anomalies. The instrument availability was improved, and in addition the amount and complexity of operations in case of SEU anomaly was reduced.
• The ASCAT level-2 Soil Moisture products became operational on Dec. 18, 2008. The trial dissemination of Soil Moisture products started on May 26, 2008. 26)
• The operational phase of MetOp-A started on May 15, 2007 when the spacecraft was officially declared operational after six months of commissioning. This official start of regular operations marks a new milestone in the ongoing development of the US-European Initial Join Polar System - and for the overall global cooperation between Europe and the US. It should be noted that some calibration and validation activities are still ongoing, and not all Level 1 products are operational yet. 27)
• The geographical coverage of the measured occultations of the GRAS instrument is shown in Figure 14 for Nov. 1, 2006. On that day 660 occultations were recorded, 338 setting ones and 322 rising ones. The coverage is globally homogenous, which demonstrate that GRAS will provide precious profiles over sparsely covered regions such as oceans and polar regions. The required number of occultation per day is 500, which is met with substantial margins. All performances for GRAS as a simple GNSS receiver and as an atmospheric sounder are well within specifications (Ref. 72).

Figure 14: Geographical coverage of the GRAS occultations within a day period (image credit: ESA)
• The LRPT (Low Rate Picture Transmission) system experienced an on-orbit failure just 11 days after turn-on and the HRPT-A after 6 months of operation - due to harsh particle radiation effects. 28) 29)
After the LRPT and HRPT-A subsystems failed, EUMETSAT engineers tested the system components in the laboratory and found that a component common to both failed instruments as well as the still functional HRPT-B was susceptible to impacts from particles with high linear energy transfer (LET). Particles with high LET are heavy energetic particles that create enough charge separation as they pass through semiconducting material to cause damage. Activation of the HRPT-B system was delayed until a plan could be developed to operate the instrument safely given its vulnerabilities. That plan required a better understanding of the space particle radiation environment, particularly the heavy ion population.
However, the cooperative effort of engineers and space physicists from EUMETSAT, NOAA and NRL (Naval Research Laboratory) salvaged some of the capability of the HRPT by identifying limited areas in the spacecraft's orbit with low particle radiation where the remaining HRPT-B subsystem could be used safely. Upon completing the analysis of anomaly rates, NOAA physicists provided EUMETSAT operators with 3 sets of tables containing anomaly rates as a function of geographic latitude and longitude. The new operating mode accommodated customers in need of local weather forecasting data while still protecting the instrument and extending the lifetime. Due to these efforts the HRPT-B has been in use since September 2008 lasting now 3 times as long as its failed counterpart (Ref. 28).
• On Oct. 27, 2006, the ASCAT instrument was switched on for measurement.
• On 26 October 2006 the GRAS instrument was switched on. Within 23 seconds the instrument tracked a first GPS satellite, and 64 seconds after the first navigation solution was achieved. On 27 October, the instrument was switched to occultation mode and the first occulting GPS satellites were measured (Ref. 72).
• The SIOV (Satellite In-Orbit Verification) phase started Oct. 23, 2006, following the Metop-A handover from the LEOP service, performed by ESA/ESOC, to EUMETSAT. After a very intense period, some anomalies and many successes, the SIOV activities eventually came to an end and the SIOV Review formally closed this phase on 29 March 2007. 30)
• After separation from the launcher Fregat upper stage, the satellite entered an automated sequence which allowed to initialize its in-orbit operations. The solar array was deployed successfully, and the attitude acquisition and control sequence was executed nominally. The deployment of several antennas was also performed flawlessly. First orbit correction maneuvers were achieved with very good accuracy, and the Launch and Early Orbit Phase (LEOP) operations were concluded, allowing the start of the commissioning phase.
MetOp-A Sensor Complement
MetOp-A carries 13 instruments provided cooperatively by Eumetsat, ESA, NOAA and CNES. They vary from the largely recurrent units (AVHRR, HIRS, AMSU-A1/A2) developed within the US Polar Orbiting Environmental Satellite (POES) Program to wholly new instruments developed specifically for MetOp (IASI, ASCAT, GRAS). 31)
For a description of AVHRR/3, HIRS/4 and AMSU-A, see the NOAA-POES documentation.
|
Payload Sensor |
Mission Objectives |
Sensor Provider |
|
AVHRR/3 (Advanced Very High Resolution Radiometer) |
Global imagery, global sounding, ocean measurements (SST), clouds and Earth radiation budget, land measurements |
NOAA |
|
HIRS/4 (High Resolution Infrared Sounder) |
Global sounding, atmospheric minor constituents, (ozone) |
NOAA |
|
AMSU-A (Advanced Microwave Sounding Unit-A - A1 & A2) |
Global sounding, sea ice |
NOAA |
|
MHS (Microwave Humidity Sounder) |
Global sounding, clouds and Earth radiation budget, sea ice |
EUMETSAT |
|
IASI (Infrared Atmospheric Sounder Interferometer) |
Global sounding, ocean measurements (SST), clouds and Earth radiation budget, some atmospheric trace constituents, land measurements |
CNES/ |
|
ASCAT (Advanced Scatterometer) |
Ocean measurements, surface stress and surface wind |
ESA |
|
GOME-2 (Global Ozone Monitoring Experiment-2) |
Atmospheric trace gases (ozone content and profile) |
ESA/ |
|
GRAS (GNSS Receiver for Atmospheric Sounding) |
Atmospheric refractive index measurement in limb-sounding mode |
ESA/ |
|
Argos-3 (Remote Data Collection System), |
Data collection and location; ADCS on-board, PTTs and DCPs in the ground segment |
CNES |
|
S&R ( Search and Rescue System) |
Cooperative satellite-based radiolocation system for search and rescue operations. Relay of emergency radio signals to ground stations from aviators, mariners and land travellers in distress. |
CNES/NOAA |
|
SEM-2 (Space Environment Monitor-2) |
Monitoring of the S/C environment (solar-terrestrial) |
NOAA |
Table 5: Overview of MetOp-A payload complement
ASCAT (Advanced Wind Scatterometer)
ASCAT is an active ESA instrument, developed by EADS Astrium GmbH of Friedrichshafen (Germany) under contract to Astrium SAS, France (the ASCAT design is of AMI-SCAT heritage flown on ERS-1 and-2). Objective: Determining wind vector fields at sea surface by measuring the backscattering coefficient [normalized radar cross section sigma-naught (σo), also referred to as NRCS] on a global basis. The requirement calls for the measurement of wind speeds in the range of 4-24 m/s with an accuracy of 2 m/s and a direction accuracy of ±20º. In addition to measuring wind vectors, ASCAT will also help monitor snow and ice distribution over land and sea. 32) 33) 34) 35) 36) 37)
ASCAT is a real-aperture C-band (5.255 GHz) dual-swath and three-look radar instrument with high radiometric resolution and stability. The design of the system exploits the LFM (Linear Frequency Modulation) measurement principle on the basis of long transmit pulses (about 10 ms) with linear frequency modulation (chirps). This permits the application of low-peak transmission power (about 120 W) and frequency domain processing. ASCAT sequentially illuminates two strips (swaths) of the sea surface (two 550 km wide swaths, one on either side of the satellite ground track). This feature results in fast global coverage capability (twice as fast as ERS-1 and -2). The major differences between ASCAT and AMI-SCAT are:
- Enhanced coverage due to double swath operation
- Spatial resolution: increased spatial resolution is provided on an experimental basis
- Use of solid-state technology
- Improved radiometric performance (accuracy and inter-beam stability)
- Reduced downlink data rate due to on-board data processing (from 1.4 Mbit/s on AMI-SCAT to 55 kbit/s on ASCAT)
- In addition to the processing of echo signals, the instrument also performs an internal calibration process within each pulse repetition interval
- Reduced power needed for the transmission of continuous-wave pulses (about 120 W of peak power are needed for ASCAT compared to 4.8 kW for AMI-SCAT on ERS-1).

Figure 15: ASCAT observation principle (image credit: ESA)
|
Parameter |
Nominal mode |
High-resolution mode |
|
Center frequency |
5.255 GHz |
|
|
Swath width (full performance) Swath width (reduced performance) |
500 km 550 km |
|
|
Swath length |
continuous |
|
|
Incidence angle mid near at H min |
25º |
|
|
Localization accuracy |
4.4 km |
|
|
Polarization |
vertical |
|
|
Cross polarization |
>20 dB |
|
|
Spatial resolution |
50 km |
25 - 37 km |
|
Spectral resolution |
0.0195/km |
|
|
Sampling interval |
25 km |
12.5 km |
|
Radiometric resolution at low wind (minimum backscattering) |
2.5 - 7.1% |
6.0 - 17.6% |
|
Radiometric resolution at high wind (maximum backscattering) |
2.0 - 2.7% |
5.0 - 9.1% |
|
Radiometric accuracy |
0.47 - 0.55 dB pp |
0.48 - 0.56 dB pp |
|
Interbeam radiometric stability |
0.33 - 0.41 dB pp |
0.33 - 0.41 dB pp |
|
Ambiguity under worst case scenario |
0.34 - 3.3% |
0.34 - 3.3% |
|
Dynamic range (backscatter coefficients on the ground at near and far swath) |
-8.6 - 4.3 (near) dB -28.6 - -8.8 (far) dB |
-8.6 - 4.3 (near) dB -28.6 - -8.8 (far) dB |
|
Aliasing error |
0.08% |
0.08% |
Table 6: Performance parameters for ASCAT in nominal and high-resolution modes
The ASCAT instrument consists of the following elements: Antennas (6), SFE (Scatterometer Front End), RFU (Radio Frequency Unit), HPA (High Power Amplifier), DPU (Digital Processing Unit, PDU (Power Distribution Unit), and ICU (Instrument Control Unit).
ASCAT employs three antennas for each of the two swaths to obtain wind speed and wind direction measurements with ambiguity present. All six antennas are slotted waveguide aluminum arrays. One antenna in each set is looking sideward at 90º (cross-track direction), one forward at 45º, and one aftward at 135º (see Figure 16). All antennas form a fan beam with narrow azimuth pattern and a relative wide elevation pattern, resulting in a swath of about 550 km. The local incidence angles are between 25-65º (mid near at H min = 25º). In each swath a regular grid of points (nodes) is defined where the σo triplet values are determined. The internode distance is 25 km for nominal resolution, and 12.5 km for high-resolution observations. The wind data at each node are extracted from a wind model. The spacing of the resulting wind vectors after processing will be 50 km or better. Information on sea ice cover, snow cover and other parameters can also be derived from the basic σo data, making this instrument of great importance for many disciplines. 38) 39)

Figure 16: Top view of ASCAT observation geometries

Figure 17: Block diagram of ASCAT (image credit: ESA)
The received echo signal is de-chirped with an image of the transmitted pulse, filtered and down-converted to baseband. The baseband signal is sampled and processed by the on-board digital signal processor. This processing consists of a power spectrum estimation (transformation to the frequency domain and square modulus detection) followed by (spatial) low-pass filtering. This results in echo power spectra, where each frequency corresponds to a specific slant range distance.
ASCAT is calibrated by using an instrument-internal calibration unit which monitors potential variations in transmitted power and receiver gain. External calibration is achieved by using ground transponders and the Amazonian rain forest. 40)
The ASCAT instrument has a mass of 260 kg, a power consumption of 215 W, and a data rate of 42 kbit/s.
MHS (Microwave Humidity Sounder)
MHS is a EUMETSAT instrument, built by EADS Astrium Ltd., UK. MHS is a five-channel self-calibrating instrument, providing humidity profiling capability in the frequency range of 89 - 190 GHz. The channels 2-5 provide a humidity sounding capability (water vapor absorption line), while channel 1 measures the Earth's surface temperature and emissivity, in conjunction with the AMSU-A window channels, and detects cloud and precipitation contaminated pixels. The MHS instrument is a total power radiometer which measures the total noise power from the scene. MHS scans in the cross-track direction at a rate of 2.66 seconds (the scan is synchronized with AMSU-A). The Earth view and two calibration views are scanned at a constant velocity, rapid acceleration/deceleration is during the intervening periods. The circular IFOV (pixel) has a diameter at nadir of 16 km. The swath width (about 2000 km) corresponds to 90 contiguous pixels. 41) 42)

Figure 18: Illustration of the MHS instrument (image credit: ESA)
MHS is a compact quasi-optical heterodyne radiometer, consisting of the following elements: reflector, receiver (quasi-optical front end, amplifiers, filters, video detectors), scan mechanism, on-board calibration target, and an electronics unit. The instrument mass is 63 kg, power < 93 W. While the MetOp-specific instruments use the European OBDH (On-board Data Handling) standard interface, MHS is using the MIL-STD-1553 interface. Both of these standards are high-level command and control interfaces, permitting the use of instrument intelligence.
• Detectors: The MHS contains four detectors, one per channel. The fifth channel is achieved by splitting the 183.311 GHz signal into two channels, each with a different bandwidth.
• Scanning: An offset paraboloid reflector is mechanically rotated in order to provide a scan of the Earth, the onboard calibration (hot) target and the deep space (cold) target. The Earth is scanned in a direction perpendicular to the direction of the satellite's path (i.e. across track scanning). - The reflector rotates once per 2.667 seconds, with a slower rate of rotation when viewing the Earth and targets but at a faster rate in between. The scan motion of the reflector is fully compensated for momentum by a counter-rotating flywheel to minimize the disturbances to the satellites' AOCS. This flywheel is controlled independently to the reflector.
• To provide an interface between the MHS instrument and the payload module (PLM), a separate electronics unit, called the MPU (MHS Protocol Conversion Unit), is used, for handling commands, telemetry and the science data. This unit interfaces with various other equipment in the Payload Module. The MPU has been designed and developed by Alcatel Space, Switzerland.
• FOV (Field of View): The FOV of the instrument is circular, and the 'footprint' is approximately 16 km in diameter at the Earth's surface in the nadir direction. The MHS instrument takes 90 separate data samples (pixels) for each of the five channels during each scan across the Earth view (see section Overview). Each subsequent scan will provide Earth view data from a swath immediately adjacent to the previous scan. This 'scan mode' is the normal operational mode of the MHS. However, the MHS can also be operated in a Fixed View Mode. In this mode, the reflector remains in any defined static position, throughout all data sampling.

Figure 19: MHS Earth scan geometry (image credit: ESA)
|
Parameter |
Channel 1 |
Channel 2 |
Channel 3 |
Channel 4 |
Channel 5 |
|
Center frequency (GHz) |
89.0 |
157.0 |
183.311±1 |
183.311±3 |
190.311 |
|
Channel bandwidth (max, GHz) |
2.8 |
2.8 |
2 x 0.5 (dual side band) |
2 x 1.0 (dual side band) |
2.2 |
|
Center frequency stability (MHz) |
-0, +7 |
-40, +34 |
-27, +18 |
-27,+18 |
-5, +36 |
|
Polarization |
V |
V |
H |
H |
V |
|
Temperature sensitivity (k) |
0.22 |
0.52 |
0.24 |
0.21 |
0.57 |
|
Calibration accuracy (abs K) |
0.42 |
0.24 |
0.16 |
0.42 |
0.29 |
|
Beam efficiency (%) |
94.6 |
99.0 |
95.4 |
95.4 |
94.9 |
|
Beamwidth (º) |
1.12 |
1.17 |
1.02 |
1.02 |
1.05 |
|
Beam pointing (º) |
0.01 |
0.01 |
0.01 |
0.01 |
-0.02 |
|
Cross polarization (%) |
1.2 |
0.6 |
3.5 |
3.5 |
1.9 |
Table 7: MHS instrument performance parameters
Note: Under the MOU between EUMETSAT and NOAA concerning cooperation for polar satellite systems, the MHS instrument is also being flown on the NOAA POES series (EUMETSAT-funded instrument) with a first flight planned on NOAA-N. MHS is used in conjunction with AMSU-A and replaces the AMSU-B in the POES series instrument baseline.

Figure 20: The MHS instrument, with scanning mechanism on the right side (image credit: EADS Astrium) 43)
IASI (Infrared Atmospheric Sounder Interferometer)
IASI (Interférometre Atmosphérique de Sondage Infrarouge) is a CNES and EUMETSAT instrument. The IASI program is led by CNES in partnership with EUMETSAT. CNES is prime contractor with technical oversight and responsibility for the entire IASI system and its components: the instruments, the data processing software, and the technical expertise center (Alcatel Space is the prime instrument contractor). EUMETSAT is funding the three recurring models of the IASI instrument. 44) 45) 46) 47)
IASI represents a significant technological and scientific step forward to provide meteorologists with atmospheric emission spectra to derive temperature and humidity. The instrument is designed to measure atmospheric spectra in the infrared. It comprises a Fourier transform spectrometer (FTS) and an associated imager.
The science requirements call for sounding of tropospheric moisture and temperature, measuring column-integrated O3, CO2, CH4, and NO2, and measuring some trace gases which drive the budget of tropospheric chemistry and contribute to the greenhouse effect. Specific objectives are:
• Provision of temperature and water vapor profiles for NWP at accuracies of 1 K absolute or 10% relative, at a high vertical resolution (1 km for water vapor profiles)
• Cloud parameters to be derived from IASI include cloud fraction, cloud top temperature, cloud height, and cloud phase
• Surface skin temperatures over land and ocean are to be derived from IASI along with a surface emissivity characterization over land
• Derivation of trace gases from IASI: ozone profiles and columnar amounts of carbon monoxide (CO), carbon dioxide (CO2), nitrous oxide (N2O), and methane (CH4).
The IASI system aims at observing and measuring twice a day the spectrum of infrared radiation emitted by the Earth from a sun-synchronous orbit, over a swath width of 2000 km. IASI is a nadir-viewing imaging interferometer operating in the SWIR to TIR spectrum from 3.62 (2760 cm-1) to 15.5 µm (645 cm-1) at moderate spectral resolution. The instrument consists of an FTS, based on a Michelson interferometer (the flat mirrors are replaced with retroreflecting corner-cube mirrors), coupled to an integrated imaging system, permitting the characterization of cloudiness inside the FOV of FTS. 48) 49) 50) 51) 52)
|
Geophysical parameter |
Vertical resolution |
Horizontal resolution |
Accuracy |
|
Temperature profile |
1 km (low troposphere) |
25 km (cloud free) |
1 K (cloud free) |
|
Humidity profile |
1-2 km (low troposphere) |
25 km (cloud free) |
10% (cloud free) |
|
Ozone total amount |
Integrated content |
25 km (cloud free) |
5% (cloud free) |
|
CO, CH4, N2O |
Integrated content |
100 km |
10% (cloud free) |
Table 8: Overview of main IASI observation goals
|
Band |
Bandwidth, FWHM resolution |
Comment |
|
Band 1 |
645-1210 cm-1 with 0.35 cm-1 (unapodized resolution) 15.5 - 8.26 µm |
Band 1 provides retrievals of temperature profiles and ozone |
|
Band 2 |
1210-2000 cm-1 with 0.5 cm-1 (apodized resolution) 8.26-5 µm |
Band 2 provides retrievals of humidity and some trace gases |
|
Band 3 |
2100-2760 cm-1 with 1.5 cm-1 (apodized resolution) 5 - 3.62 µm |
Band 3 provides retrievals of temperature & some trace gases |
Table 9: Spectral parameters of IASI

Figure 21: Spectral coverage of IASI (image credit: CNES)
Instrument: The IASI instrument comprises an onboard management unit (sensor module) and a digital processing subsystem which performs the inverse Fourier transform and the radiometric calibration. It includes also an infrared imager in the spectral range of 10.3 to 12.5 µm. The sensor module is composed of the following main elements:
• Off-axis afocal telescope that transfers the aperture stop onto the scan mirror
• A scan mirror that orientates the viewing direction with respect to geometrical and time constraints. Once released, the mirror position is servo-controlled in operating modes. The mirror remains free when the subsystem is not operational.
• An interferometer that divides the incident plane wave into two waves to recombine it after introducing an optical path difference.
• Hot optics which transmit the incoming light through the interferometer into the cold optical part. The hot optics and the interferometer plus the laser elements form the IHOS (Interferometer Hot Optics Subsystem).
• Cold optics including a field stop, which define the instantaneous field of view by four circular holes and which divide the beam into three channels and drives the energy to the detectors.
• The three-detector package is mounted on the back side of the cryo radiator that cools down to 95-100 K, using a three-stage passive radiator to reduce the instrument background and thermoelectronic detector noise.
IASI is a whiskbroom instrument which scans in the cross-track direction with a swath width of about 2052 km (FOV =±47.85º, provision of motion compensation within the scan mechanism). During the scan the mirror moves to 30 measurement positions, one every 216 ms. IFOV=3.33 º x 3.33º (about 48 km x 48 km at nadir). Within each mirror position four sub-FOV's are imaged in a 2 x 2 matrix form onto four detectors. Each sub-FOV corresponds to a circular field-of-view of 0.84º (diameter about 12 km at nadir). The total scan period of 8 seconds is coordinated with the AMSU-A scan cycle. A calibration (cold-space viewing and updating of calibration coefficients) is performed after each scan cycle. The calibration accuracy is ≤0.5 K @ 280 K; the inter-channel accuracy ≤0.2 K; NEΔT <0.228 at 280 K for all bands. Band-1 and -2 detectors are of HgCdTe type (photovoltaic), while the band-3 detectors are of InSb type (photoconductive). Data quantization = 12 bit. IASI is considered a preoperational instrument on MetOp-A.

Figure 22: Observation scheme of IASI (image credit: CNES)
|
Spectral range |
3.62 - 15.5 µm (2760 cm-1 - 645 cm-1) |
|
Spectral resolution |
8 to 70 nm (0.35 to 0.5 cm-1) |
|
FOV (Field of View) |
± 47.85º |
|
Spatial resolution |
12 km circular |
|
Sounder size |
1.1 m x 1.1 m x 1.2 m |
|
Instrument mass |
236 kg |
|
Power consumption |
210 W |
|
Data rate |
1.5 Mbit/s average (2.2 Mbit/s peak) |
|
Reliability, availability |
> 0.8 over 5 years, > 97.5% over 5 years |
Table 10: Overview of IASI performance parameters

Figure 23: Block diagram of the IASI sensor module (image credit: ESA) 53)

Figure 24: Internal view of IASI components (image credit: CNES and ESA)
An important feature of IASI is the high spectral resolution of pressure and humidity sounding despite the fact that nadir measurements are not best suited for vertical resolution. The result (about 2 km for T and humidity) is made possible by the large number of observed spectral elements that depend on temperature and water vapor concentration. This data redundancy is used to reduce the uncertainty of the retrieval and extract information with an improved vertical resolution. It is important to note that the same is not possible for the minor atmospheric constituents (CH4, N2O, SO4, and CO), of which only a few spectral features are observed and for which only a column measurement is possible. In order to retrieve a vertical profile for these constituents a better spectral resolution is required. Typical features of this nadir-sounding instrument are therefore a good horizontal resolution, detection capability limited to the major atmospheric constituents, poor vertical resolution with the exception of those quantities for which large redundancy of measurements is available.

Figure 25: Alternate internal view of IASI components (image credit: CNES and ESA)
|
Parameter |
IASI (IASI pixel) |
AMSU-A |
MHS |
AVHRR/3 |
HIRS/3 (4) |
|
Mission (s) of instrument flown |
MetOp-A, etc. |
MetOp-A, NOAA-15,etc. |
MetOp-A, |
NOAA-15,etc. |
NOAA-15,etc. |
|
Scan type |
Step and dwell |
Step and dwell |
Continuous |
Continuous |
Step and dwell |
|
Scan rate |
8 s (8 s) |
8 s |
2.667 s |
0.167 s |
6.4 s |
|
Sampling |
216 ms (216 ms) |
200 ms |
19 ms |
0.025 ms |
100 ms |
|
Scan separation |
52.69 km (23.81) |
52.69 km |
17.56 km |
1.1 km |
42.15 km |
|
Pixels/scan |
-, (120) |
30 |
90 |
2048 |
56 |
|
IFOV |
3.33º (0.84º circular) |
3.3º circular |
1.1º circular |
0.0745º square |
0.69º circular |
|
IFOV at nadir |
47.63 km, (12 km) |
47.63 km |
15.88 km |
1.1 km |
10.0 km |
|
IFOV edge cross-track (km) |
|
|
|
|
|
|
FOV |
±48.33º (49.16º) |
±48.33º |
±49.44º |
±55.37º |
±49.5º |
|
Swath (km) |
2052, (1228) |
2052 |
2134 |
2900 |
2160 |
Table 11: FOV and scan parameter comparison of major sounding instruments
The IASI onboard processing system generates calibrated atmospheric spectra from raw interferograms. Interferograms are digitized with a 16 bit resolution by the acquisition electronics and processed by the DPS (Digital signal Processing Subsystem). These spectra are ready for assimilation by users and are processed (within the onboard DPS unit) and by the associate ground segment. The following onboard functions are performed: spike elimination, non-linearity corrections, filtering and resampling, Fourier Transform, phase correction, scan mirror reflectivity correction, radiometric calibration, and variable coding. Onboard processing reduces the instrument source data rate from 45 Mbit/s to 1.5 Mbit/s (note: the interferogram of 45 Mbit/s is converted into a complex spectrum to meet the allocated data rate of 1.5 Mbit/s). 54)

Figure 26: The IASI digital processing subsystem concept (image credit: CNES)
The IASI instrument has a data rate of 1.5 Mbit/s, a design life of 5 years, power consumption of 210 W, a size of : 1.2 m x 1.1 m x 1.1 m, and a mass of 236 kg. The instrument features an onboard management unit and a digital processing subsystem which performs the inverse Fourier transform and the radiometric calibration.
IASI Infrared Imager, also referred to as CIM-01 (Caméra Infra-rouge Multimission). The IASI instrument includes also an infrared imager in the spectral range of 10.3 to 12.5 µm (atmospheric window) to improve the processing of partly cloudy pixels. The infrared imager enables accurate collocation between IASI and AVHRR/3 (both on MetOp) for cloud analysis (co-registering of soundings with AVHRR/3 images). The IFOV of the infrared imager coincides with that of IASI, namely 3.33º x 3.33º, the FOV is covered by a raster of 64 x 64 pixels (size of detector matrix). The radiometric performance is characterized by NEDT of 0.5 K at 280 K and a calibration accuracy of better than 1 K at 280 K. The positioning error of imager pixels with respect to the pixels of IASI is less than 0.05º. 55)
|
Parameter |
Value |
Parameter |
Value |
|
FOV |
60 mrad x 60 mrad |
Spatial resolution |
64 x 64 pixels |
|
Spectral range |
10.3 - 12.5 µm |
Optics speed |
f/2.4 |
|
Image frequency |
4.6 Hz |
NEDT |
< 0.5 K @ 280 K |
|
Measurement dynamic |
175 to 315 K |
Blind pixels |
< 20 |
|
MTF @ Nyquist |
0.35 |
Linearity |
< 1% |
|
Response non-uniformity |
< 5% (1σ) |
Distortion |
< 0.2 mrad |
Table 12: Performance parameters of the IASI Infrared Imager
The imager design (EADS Sodern) includes two subassemblies: 1) the optical module including lens and detector, 2) the electronic module. The technology features an uncooled microbolometer array in the focal plane. The detector is a standard COTS uncooled infrared sensor assembly, U3000A, manufactured by DRS Technologies Inc. (formerly Boeing/Rockwell). The instrument has a mass of 5.5 kg, power consumption of 8 W, and video output data of 12 bit. Apart from the IASI program, a modified version of this imager is also flown on the CALIPSO mission as IIR (Imaging Infrared Radiometer).

Figure 27: Photo of the IASI instrument (image credit: CNES)
The CNES role in IASI: 56)
CNES has technical oversight responsibility for the instruments development up to their deliveries to EUMETSAT. Moreover, CNES has developed the onboard processing software DPS ((Data Processing Software), the level 1 processing chain (L1/PPF) and the software deployed at the IASI expertise center (IASI-TEC) located in Toulouse. During the exploitation phase, CNES is responsible for the instrument calibration, it operates IASI-TEC and maintains the IASI L1/PPF. The latter is operated by EUMETSAT in Darmstadt (Germany).
The IASI system is composed of the on-board segment (the instrument and the associated on-board processing software), the ground segment (the level 1 processing chain) and the IASI-TEC. The latter is in charge of the instrument performance monitoring, performance-related anomaly investigation, the development and validation of new algorithms and the maintenance of the on-board and ground software. The IASI system relies on the CNES-EUMETSAT cooperation. The main interfaces between the IASI expertise center and EUMETSAT are presented in Figure //earth.esa.int/web/eoportal/satellite-missions/m/metop#GbJ@B13b9Herb" style="color: rgb(0, 155, 207);">28.
As of 2010, the IASI-TEC has continuously and rigorously monitored the IASI instrument onboard MetOp-A for more than 3 years. It plays a key role in maintaining the whole IASI system performance. Using the feedback from the instrument commissioning phase, a monitoring strategy has been defined for the routine phase. This allows to report that the instrument is actually behaving very well: radiometric, geometric and spectral performances are all compliant with the specifications. Generally speaking, the instrument is very stable over time.

Figure GbJ@B13b9Herb" style="color: rgb(0, 155, 207);" name="GbJ@B13b9Herb">28: Main interfaces of the IASI-TEC (image credit: CNES)
IASI status in the fall of 2011:
In the 5 years of operational service so far, IASI has provided valuable new data, allowing important new developments in the fields of NWP and atmospheric composition analysis. The excellent calibration and stability of the instrument, and the expected long time series of data, indicate that it will also make important contributions to climate studies. New applications for IASI are still emerging as the data are investigated more thoroughly. 57)
IASI has given significant positive forecast impact at NWP centers in both global and regional models, with data at a higher vertical resolution than has been seen before from an operational sounder. Unlike older operational sounders, significant amounts of IASI data can be used in cloudy conditions; nevertheless, more progress needs to be made to get closer to extracting the full information content in the observations.
IASI has also provided unprecedented atmospheric chemistry data, allowing near-real-time mapping of chemical species and aerosols, contributing to air traffic safety and to our understanding of atmospheric transport processes. Observations from IASI have unexpectedly allowed the detection from space of volatile chemical species, providing an ability to map sources and sinks of gases, such as ammonia.
IASI exhibits sensitivity to the change in quantities of greenhouse gases. The data can be used to study cloud and aerosol properties, and will provide information on a range of other climate variables. It is expected that IASI will gather real-time information about the atmospheric state at higher vertical resolution, notably moisture and winds, and thus will form a critical component of the global observing system for climate studies.
GOME-2 (Global Ozone Monitoring Experiment-2)
GOME-2 is a medium resolution, nadir-viewing and cross-track scanning spectrometer of GOME-1 heritage flown on ERS-2 (launch 1995). GOME-2 measures the solar radiation transmitted or scattered from the Earth's atmosphere or from its surface. The ESA/EUMETSAT jointly-funded instrument was designed and built by the prime contractor Galileo Avionica, Italy.
The overall objectives of GOME-2 are: measurement of total column amounts and stratospheric and tropospheric profiles of ozone. In addition: measurement of column amounts of H2O and other trace gases involved in ozone photochemistry (like NO2, OClO, BrO, and possibly ClO in polar spring conditions, and pollutants like SO2 and HCHO). GOME can also be used to investigate the distribution of atmospheric aerosols and clouds-plus-surface spectral reflectance. Atmospheric chemistry is of vital importance in the evolution of the planetary climate, and an indicator in particular of anthropogenic impacts on the atmosphere. 58)
Although GOME-2 is considered a ”recurrent” instrument (the basic design of GOME-2 being the same as that of GOME-1), a number of technical improvements were made based on the experience with GOME-1 operations and data analysis and in response to more stringent user requirements. Particular improvements concern spatial resolution, polarization measurements, and calibration.

Figure 29: The GOME-2 instrument (image credit: ESA)

Figure 30: Block diagram of GOME-2 optics with the differences to GOME-1 highlighted (image credit: ESA)
The GOME-2 instrument consists of the following modules or units: 59) 60)
• Double grating spectrometer (one each for polarized and unpolarized light): almost identical to the GOME-1 instrument. The major change for the GOME-2 spectrometer resulted from the accommodation of the more complex PMU (Polarization Monitoring Unit) on GOME-2. The main spectrometer (for unpolarized signal) splits the incoming light into four channels. It does this by a complex array of telescopes and prisms. Detectors at the end of each optical path collect information about the signal in each channel.

Figure 31: Illustration of the GOME-2 spectrometer (image credit: SRON)
• PMU (Polarization Monitoring Unit): The new PMU provides polarization information (with sufficient accuracy to correct for the polarization dependence of the instrument) by monitoring the spectral range using 200 pixels with a spectral resolution of between 2.8 to about 40 nm, the integration time is 23 ms. The s- and p-polarized parts of the radiation are measured simultaneously. The s- and p-channels have an identical FOV with the main channel. Note: other major ozone measuring instruments like TOMS, SBUV and OMI disregard the measurement of polarization.
• FPA (Focal-Plane Assembly). There are a total of six FPAs, four are assigned to the spectrometer channels and two to the new polarization channels. Each FPA contains a random-access linear silicon photodiode array, consisting of 1024 elements, which is reverse-biased and operates in charge accumulation mode. The detectors are cooled to -38º C for the spectrometer channels and to 0º C for the PMU channels.
• SU (Scan Unit): SU features a rotating mirror, positioning in front of the spectrometer. The mechanical assembly is almost identical to that of GOME-1. The electronics assembly of GOME-2 allows five constant scan profiles and five new scans, compensating for the Earth's curvature and providing a constant linear scan speed on the ground. A new wide-amplitude scan corresponding to 1920 km on the ground, is also implemented. The wider swath permits global coverage in 1.5 days. All scans are reprogrammable. The basic scan timing is 4.5 s in the forward and 1.5 s in the flyback scan.
• CDHU (Command and Data Handling Unit): A processor is responsible for all ICU (Instrument Control Unit) functions such as command handling, maintenance of history file, monitoring of instrument parameters and format handling. CDHU provides 12 predefined timelines, each dedicated to a specific orbit sequence.
• CU (Calibration Unit): The unit contains two light sources (spectral light and white). The white light source is used to monitor the etalon, present on the cooled detectors. The spectral light source is a hollow cathode lamp filled with a mixture of neon and argon. The calibration unit has in addition a diffuser in support of solar calibrations.
|
Principle |
Nadir-scanning UV/VIS grating spectrometer |
|
|
Spectrometer type |
Double monochromator with pre-disperser prism and 4 holographic gratings |
|
|
Spectral range |
240 - 790 nm (UV, VIS) |
|
|
IFOV (Instantaneous Filed of View) |
0.286º cross-track x 2.75º along-track, or 4 km x 40 km respectively |
|
|
Entrance slit dimension |
0.2 mm cross-track x 9.6 mm along-track |
|
|
Channels and resolution |
1: 240 - 315 nm |
0.22 - 0.28 nm (FWHM spectral resolution) |
|
Polarization |
256 detector pixels |
|
|
Monitoring unit |
312 - 790 nm in 12 programmable bands |
|
|
Viewing modes |
|
|
|
Spectral calibration |
Fixed angle (once per day to once per month) |
|
|
Spatial resolution |
40 km x 40 km (with 960 km swath and integration time of 0.1875 s) |
|
|
Detectors |
1024 element Reticon linear diode arrays |
|
|
Instrument data rate |
400 kbit/s |
|
|
Instrument mass, power |
73 kg, 42 W (average) |
|
|
Instrument size |
656 mm (zenith, nadir) x 848 mm (cross-track) x 468 mm (along-track) |
|
Table 13: Major parameters of the GOME-2 instrument
Measurement concept: Grating spectrometers like GOME are sensitive to the state of polarization of the incoming radiation. The light reflected by the Earth's atmosphere is partially polarized, the degree of polarization varying with the atmospheric conditions and the geometric relation between the sun and the line of sight. This effect would cause the instrument radiance responsivity to vary accordingly. However, to overcome this effect, GOME-2 measures the intensity of the plane polarized light in two orthogonal polarization planes (parallel and perpendicular to the entrance slit), in 15 bands in the 240-790 nm spectral range with a resolution of 0.22-0.50 nm. The Double Brewster/Pre-disperser combination separates the two orthogonal components of light from the main beam. There are two PMDs (Polarization Measurement Device), one for each polarization component, being both identical. By means of prisms and lenses each polarized beam is dispersed and focussed onto the PMD Focal Plane. The response of the instrument to the linearly polarized light is determined during instrument calibration. This allows correction of the main channel measurements for the polarization sensitivity of the instrument. It is assumed that the instrument sensitivity to the state of polarization of the non-linearly polarized light is negligible.

Figure 32: Schematic of GOME-2 calibration unit optics (image credit: ESA)
GRAS (GNSS Receiver for Atmospheric Sounding)
GRAS was designed and developed in a joint effort by Saab Ericsson Space (SES) of Sweden and AAE (Austrian Aerospace), co-funded by ESA and EUMETSAT. The objectives are to provide atmospheric temperature and humidity profiles. The data may be used in such applications as NWP (Numerical Weather Prediction) models. RO (Radio Occultation) of the atmosphere is a well-proven technique whose performances have been demonstrated for Earth atmospheres by GPS/MET and its successor TRSR, both instruments were developed at JPL. 61) The measurement principle is based on the fact that microwave signals passing through the atmosphere up to a LEO satellite at the limb are bent and delayed due to the variations of the refractive index of the various layers of the atmosphere and the ionosphere. The refractive index depends upon the pressure, temperature and humidity of the atmosphere. 62) 63) 64) 65) 66) 67) 68) 69) 70)
Note: At the start of the GRAS project, the initial goal was to use both the GPS and the GLONASS constellations. However, during the course of the Metop phase B, GLONASS capabilities have been descoped resulting in an implementation which considers only the GPS tracking capabilities.
GRAS is a dual-frequency GPS high-performance instrument with semi-codeless operating capabilities. The codeless capability is mandatory in order to mitigate the anti-spoofing (encryption of the precise code), which prevents civilian users from benefitting from the P-code on the L2 frequency. The instrument provides carrier, code phase and signal amplitude measurements. The second GPS frequency (L2) is used for ionospheric correction of the signals. GRAS features twelve dual-frequency channels, four for rising and setting occultations and eight for navigation. The navigation channels provide the position of the Metop satellite in real-time. Carrier and code phase data are also provided for the processing of the precise orbit determination of Metop (position and velocity) necessary for the ground processing of the occultation data and in particular the effects on the Doppler caused by the GPS signal passing through the atmosphere and the troposphere. A ground network of GPS receiver tracking stations is used for determining the actual orbits of the GPS satellites. This ground network can operate in differential mode in order to cancel clock error variations. - The GRAS instrument consists of the following elements:
• Antennas. The three GRAS antennas are pointed in the satellite's velocity, anti-velocity, and zenith directions. The GVA (GRAS Velocity Antenna) and the GAVA (GRAS Anti-Velocity Antenna) are phased arrays, each containing 18 dual-band patches with a shaped antenna pattern optimized for the occultation of the Earth's limb and its atmosphere. The GRAS zenith-looking antenna (GZA) with eight dual-frequency channels is used for navigation measurements. 71) 72)
• RFCU (RF Conditioning Unit). Each of the three RFCUs consists of two extremely steep bandpass filters, a low-noise amplifier and a single down-converter stage to IF (Intermediate Frequency). The IF signals are fed into the GEU.
• GEU (GRAS Electronics Unit). The GEU is built around the ESA-developed AGGA (Advanced GPS/GLONASS ASIC). 73) The AGGA simultaneously performs the final down-conversion, de-spreading, and correlation of four dual-frequency GNSS channels. A number of AGGA observables are delivered to the TSC2102OE DSP, an ESA-funded Digital Signal Processor which performs the functions of: measurement, signal tracking, navigation solution, time management, and measurement data processing.

Figure 33: Elements of the GRAS instrument (image credit: ESA)

Figure 34: GRAS is composed of 3 antennas, 3 Radio Frequency conditioning units, 1 electronic box and a deployment mechanism (image credit: ESA)
The GRAS DSP board is based on the radiation tolerant TSC 21020 processor. The DSP board is used to control the instrument and to perform all onboard data processing. The processed and formatted data is provided to the spacecraft OBDH (Onboard Data Handling) bus via the SCIF (Spacecraft Interface) board.
|
Parameter |
Value |
Parameter |
Value |
|
Measured temperature accuracy |
1 K |
Horizontal resolution |
100 to 300 km |
|
No of occultation channels (set+rise) |
4 |
Vertical resolution Fresnel zone |
300 to 1500 m |
|
No of navigation channels |
8 |
High vertical resolution (troposphere) |
100 m |
|
No of occultations/day |
500 |
Navigation solution accuracy |
100 m |
|
USO frequency stability |
1 x 10-12 |
Bending angle budget @ 30 km |
0.42 µrad |
|
Instrument mass |
30 kg |
Instrument data rate (mean, max) |
27 kb/s |
|
Occultation antennas |
|
Navigation antenna |
|
Table 14: GRAS performance parameters
The GRAS instrument provides more than 500 occultations/day, with quasi-uniform geographical distribution, a vertical temperature sounding of 1K rms, with a vertical resolution of 100 m in the troposphere and 1.5 km in the stratosphere over an altitude range of 5 to 30 km. In addition, GRAS provides an opportunity to establish the height of the tropopause with a vertical accuracy of better than 1 km. The horizontal resolution of the radio-occultation technique, limited by the limb-sounding approach itself, is in the order of 100 km in the troposphere and 300 km in the stratosphere. 74)
|
Level-1 products |
Level-2 products |
|
Residual phase data |
Refractivity profiles |
|
Sounding occultation table |
Temperature profiles |
|
Navigation data |
Moisture profiles |
|
Total bending angle as a function of the impact parameter at L1 and L2 |
Pressure profiles |
|
Ionospheric corrected total bending angle |
Integrated precipitable water vapor |
|
TEC |
Temperature and humidity retrieval parameters |
|
Auxiliary data |
Observation error characteristics |
|
Earth orientation parameters |
TEC |
|
Observation error characteristics |
|
Table 15: Overview of GRAS level-1 and level-2 products

Figure 35: The radio occultation measurement concept as used by MetOp-GRAS (image credit: RUAG Space) 75)
GRAS ground segment: The GRAS SAF is part of EUMETSAT's network of Satellite Application Facilities (SAFs) under the EUMETSAT Polar System (EPS). The objective of the GRAS SAF is to deliver operational radio occultation products from the GRAS occultation instruments (Global Navigation Satellite System Receiver for Atmospheric Sounding) onboard the three MetOp satellites. The leading entity is the Danish Meteorological Institute (DMI) and this is also the physical location of the operational GRAS SAF processing and archiving center. The other project partners are: 76) 77)
• IEEC (Institute d'Estudis Espacials de Catalunya, Barcelona, Spain)
• Met Office (Exeter, UK)
ECMWF (European Center for Medium-range Weather Forecasts), UK
The GRAS SAF started the operational phase in March 2007. The archiving of GRAS SAF products is done locally at DMI. The role of the GRAS SAF is to facilitate the input from the GRAS instrument on MetOp to NWP and climate change models in order to increase the usage of satellite data in a more effective manner than possible today.
The main users of the GRAS SAF products are meteorologists doing data assimilation, and users from the climate research and atmospheric science communities, needing comprehensive, globally distributed temperature, pressure, and humidity information. The products come in two types:
• Near-Real Time (NRT) products, disseminated less than three hours after acquisition (primarily for NWP use)
• Improved Offline Products, available less than 30 days after acquisition (primarily for climate research use).
An enhanced version of the GRAS instrument, called GPSOS (GPS Occultation Sensor), will fly on the JPSS (Joint Polar Satellite System) series of NOAA and NASA.
Argos / A-DCS (Advanced Data Collection System)
Argos/A-DCS is an advanced Argos system (also flown on NOAA-N') and provided by NOAA. The objectives are data collection and location from PTTs (Platform Transmitter Terminal) and DCPs (Data Collection Platform) in the ground segment PTTs and DCPs are both part of the Argos ground segment for environmental data measurement. 78)
Argos/A-DCS is also known as Argos-3, the new generation Argos system -- and MetOp-A is the first LEO spacecraft on which Argos-3 is being flown. Argos-3 provides enhanced and new capabilities in data collection. In particular, this relates to higher data rates between the spacecraft and the ground segment, and to the new downlink capability. This means, that PTTs (with the required capability) can now be configured via the spacecraft. 79)
The A-DCS unit is provided by CNES for flight on the MetOp mission. The Argos system is operated and managed by CLS (Collecte Localisation Satellites), a CNES subsidiary in Toulouse, France, and Service Argos Inc., a CLS subsidiary in Landover, MD, USA.

Figure 36: Artist's view of the Argos Data Collection system elements (image credit: NOAA, EUMETSAT)
The primary objective of a DCS is the collection and dissemination of data for the scientific community, through the measurement of temperature, pressure, humidity, sea levels and location. The data are then transmitted to the user community through the Argos network. Flying the Argos system aboard polar-orbiting satellites provides worldwide coverage. Additionally, incorporating the A-DCS instrument on a moving satellite allows for locating an in-situ platform using Doppler shift calculations. This positioning capability permits applications such as monitoring drifting ocean buoys and studying wildlife migration paths.
The system is used with great success in the following applications:
- Studying oceans and atmospheric conditions
- Preserving and monitoring wildlife
- Monitoring volcanoes
- Monitoring fishing fleets
- Monitoring shipments of dangerous goods
- Humanitarian applications
- Managing water resources.

Figure 37: Functional block diagram of Argos A-DCS (image credit: EADS Astrium, EUMETSAT)
S&RSAT (Search&Rescue Satellite Aided Tracking System)
The S&RSAT payloads are part of an international cooperative satellite-based radiolocation system (COSPAS-S&RSAT) to support search and rescue operations for aviators, mariners, and land travellers in distress. The S&RSAT payload consists of S&RR (S&RSAT Repeater), provided by CRC/Canada; and S&RP (S&RSAT Processor), provided by CNES/France). 80) 81)
|
Spacecraft Repeater (121.5, 243, and 406 MHz) |
|
|
Bandwidths (Doppler shift + drift + Tolerance + guardband) |
|
|
Parameter |
Specification |
|
121.5 MHz |
25 kHz (bandwidth) |
|
243 MHz |
46 kHz |
|
406.050 MHz |
100 kHz |
|
Transmitter power (1,544 MHz) |
8 W decibels referenced to a watt (dBW) |
|
Physical Characteristics |
|
|
Mass, size, power |
24 kg, 0.034 m3, 53 W |
|
Spacecraft 406 MHz Processor |
|
|
Max bandwidth, storage capacity, output data rate |
80 kHz, 324 kbit, 2.4 kbit/s |
|
Physical characteristics |
|
|
Mass, size, power |
27.5 kg, 0.034 m3, 33 W |
Table 16: S&RSAT subsystem parameters
The communication link specification for the Argos/A-DCS and S&RSAT services are:
• A-DCS data reception at 401.65 MHz
• A-DCS data transmission at 466 MHz
• S&RR beacon signal repetition at 121.5 MHz, 243 MHz, and 406.05 MHz
• S&RP-3 data reception at 406.05 MHz (common with S&RR)
• S&RR data transmission at 1544.5 GHz.

Figure 38: Overview of the S&RR concept and relationship between SARR and SARP-3 (image credit: ESA)
Note: Although the original acronym for `Search and Rescue' is `SAR' in the context of NOAA (or MetOp) missions, it was changed in this documentation consistently to `S&R' in order to distinguish it from the other widely-used meaning of SAR, namely `Synthetic Aperture Radar,' an active sensor type and observation technique. A consequence is the use of `S&RSAT' (instead of SARSAT), to use S&RP instead of SARP, as well as to use S&RP-3 instead of SARP-3.

Figure 39: Block diagram of the LEO S&RR (or SARR) instrument (image credit: EUMETSAT)

Figure 40: Illustration of the S&RP subsystems (image credit: NASA)

Figure 41: Illustration of the S&RR instrument (image credit: NASA)
SEM-2 (Space Environment Monitor-2)
SEM-2 is a NOAA-provided instrument package (see description under NOAA-POES series). The SEM-2 instruments are being developed/built by Panametrics Inc., in Waltham, MA. SEM-2 is a spectrometer that provides measurements to determine the intensity of the Earth's radiation belts and the flux of charged particles at the satellite altitude. It provides knowledge of solar terrestrial phenomena and also provides warnings of solar wind occurrences that may impair long-range communication, high-altitude operations, damage to satellite circuits and solar panels, or cause changes in drag and magnetic torque on satellites. SEM-2 has three major components:
• TED (Total Energy Detector)
• MEPED (Medium Energy Proton and Electron Detector)
• DPU (Data Processing Unit)
TED measures electron and proton energy fluxes in the 0.05 to 20 keV energy range. Two independent measurements of the particle energy flux are being made at 0º and 30º from the local vertical. The MEPED provides both directional and omni-directional measurements. The directional sensors, make independent measurements of electrons and protons in several energy intervals. The omni-directional sensors measure proton energy in the following ranges: > 16 MeV, > 35 MeV, > 70 MeV and > 140 MeV.

Figure 42: Overview of SEM-2 instrumentation (image credit: NOAA)
SEM-2 is a multichannel, charged-particle spectrometer that measures the population of the Earth's radiation belts and the particle phenomena resulting from solar activity (both of which contribute to solar/terrestrial energy interchange). SEM-2 consists of separate sensor units and a common DPU (data processing unit). The sensor units are TED, MEPED, and HEPAD (occasionally). The lower-energy detectors (TED, plus the proton and electron telescopes of MEPED) have pairs of detectors with different orientations because the direction of the particle fluxes is important for characterizing the energy interchanges taking place. Objectives:
- To determine the energy deposited by solar particles in the upper atmosphere
- To provide a solar storm warning system. Large, abrupt changes occur in the solar wind. These changes produce changes in the magnetosphere and the ionosphere. This can result in hazards to people such as astronauts, there is also the potential of increased radiation exposure to people in high flying aircraft. Other functions/facilities on Earth effected by solar wind changes are: a) disruption of navigation, b) absorption, even blackout, of radio waves so that radio communication is disrupted; c) induced voltages and currents in electric power circuits leading to circuit breaker trip, damage to equipment, and failure of transformers; d) induced currents in buried pipe lines causing accelerated corrosion; e) damage by electrons and protons to satellite circuits and solar panels.
|
SEM-2 units |
Performance requirements |
Energy levels |
FOV (Field of View) |
|
TED |
Determine heat energy input into upper atmosphere from absorption of electrons, protons and positive ions. |
Electrons: 0.05-20 keV |
Two at 15º full angle, |
|
MEPED |
Same as TED |
Electrons: 30-7000 keV |
15º full angle, |
|
DPU |
Combine outputs into a 2-second, 40-word format. Provide command, calibrate and timing interfaces. |
N/A |
N/A |
|
Instrument |
Mass = 15 kg, power = 10 W, volume = 0.0186 m3, telemetry = two 8-bit wors/TIP minor frame |
||
Table 17: SEM-2 instrument parameters
TED (Total Energy Detector). TED measures the proton and electron fluxes in 16 bands in the 0.05 to 20 keV energy range. Two independent measurements of the particle energy flux are made at zero and 30 degrees from the local vertical. The total energy
measurement is divided into two ranges: 0.05 to 1 keV and 1 to 20 keV and each measurement is made independently for electrons and protons. TED also measures the maximum differential energy flux density and the energy at which it occurs for each direction and particle type (electron and proton). TED consists of eight Electrostatic Analyzers (ESA), pulse height discriminators (PHD), an In-Flight Calibrator (IFC), two high voltage (HV) supplies, a sweep voltage supply and housekeeping circuits. 82)
MEPED (Medium Energy Proton and Electron Detector). MEPED provides both directional and omni-directional measurements. The directional sensors utilize telescopes which make independent measurements of the particle types. Directional measurements are made near the local vertical and near 90º to the local vertical. Protons are measured in 6 bands in the energy range: 30 to >6900 keV. Electrons are measured in thee bands: >30 to > 300 keV. The omni-directional sensors measure proton energy in the following ranges: >16 MeV, >35 MeV, >70 MeV and >140 MeV. Each sensor consists of a dome of moderating material which absorbs energy from the particle (and so sets the detection energy threshold), a silicon solid state detector, a preamplifier, and a level comparator which responds to particles with enough energy to go through the moderator and produce a pulse from the detector large enough to exceed the level in the comparator.
The MEPED instrument consists of two proton telescopes, (each containing two solid state detectors (SSDs)), two electron telescopes (each containing a single solid state detector and four omni-directional sensors (each containing a single solid state detector), charge-sensitive preamplifiers, analog signal processors, proton and electron coincidence logic, in-flight calibrator, low-voltage regulators, SSD bias supply and analog housekeeping. The SEM-2 instrument package has a mass of 18 kg, power of 6 W, and a data rate of 166 bit/s.
|
Instrument envelope |
TED: 184 mm x 314 mm x 193 mm |
|
Instrument mass |
TED: 4.7 kg |
|
Instrument power |
< 10 W |
|
Data rate |
160 kbit/s |
Table 18: Some parameters of the SEM-2 instrument
EPS (EUMETSAT Polar System) Overview:
EPS is the European component of a joint European/US polar satellite system, the Initial Joint Polar System (IJPS) to support operational meteorology and climate monitoring. The objective of the IJPS is to share the operations between NOAA and EUMETSAT and to ensure the continuity and timely availability of meteorological data through a series of polar orbiting satellites with a mid-morning equator crossing time of 09:30 h (Europe) and an afternoon equator crossing time of 14:00 h (USA).
The main elements of the system are Space Segment and OGS (Overall Ground Segment). The Space Segment consists of the MetOP satellites and the ground-based support infrastructure. The OGS includes all ground equipment necessary to support the EPS mission in routine operation. The OGS generates data and products from both NOAA and MetOp satellites and disseminates these data to its own user community. The EPS OGS is responsible for the operation and processing of data from the Metop satellites, whilst the EPS and the NOAA ground segments share the acquisition task for the global data from both NOAA and MetOp satellites according to orbit visibility from their respective ground stations.
The OGS consists of the CGS (Core Ground Segment), the complementary elements, and the service infrastructure. CGS contains all functions for mission and spacecraft control, data processing and product generation, product quality control, online calibration, product dissemination, and archiving. The complementary OGS elements include functions that are required for the EPS mission, but that may also be shared by other missions. These elements include e.g. the UMARF (Unified Meteorological Archive and Retrieval Facility), SAFs (Satellite Application Facilities), and CAL/VAL (Calibration and Validation Facilities). The SAFs are also considered distributed elements of the data processing chain as they will generate the level 2 and level 3 meteorological and geophysical products.
The OGS infrastructure includes also GSN (GRAS Ground Support Network). The products from the GSN service include GPS position and velocity vectors, GPS and fiducial ground station clock offset estimates, GPS tracking data from the fiducial stations, Earth Orientation Parameters (EOP), Tropospheric Zenith Delay (TZD) estimates for each fiducial station, and Sounding Support Data (SSD) of the occulting GPS satellites to allow single or double differencing in the occultation processing. The GSN also handles all interfaces to the 20-30 globally distributed fiducial stations needed to collect the GPS tracking data and SSD. - All GSN products and MetOp GPS POD (Precise Orbit Determination) products will be archived and made available to the users.
EUMETSAT computes operationally the NRT (Near-Real-Time) precise orbit of the MetOp-A satellite using both the data provided by the GRAS (GNSS Receiver for Atmospheric Sounding) instrument and support data provided by the GSN (GRAS Ground Support Network). 83)
• The GSN, operated by ESA/ESOC, provides in NRT a set of precise GPS products (GPS ephemerides and high frequency satellite clock corrections) as well as other support data (i.e. Earth Orientation Parameters) which are used as input data for different NRT LEO POD processes. These products are subjected to very stringent requirements in timeliness and reliability, to ensure the required service to the meteorological community (99% of availability within 3 hours).
• The RECTILE (Real Time Clock Estimation) system, operated by the DLR GSOC (German Space Operations Center), provides in real time a set of precise GPS clock corrections, to be used with the IGS (International GNSS Service) ultra rapid orbits. The RECTILE data is made available to EUMETSAT.
Basic processing of all MetOP data is performed at CGS of EUMETSAT in Darmstadt, Germany. This is where level 1 products for all MetOp instruments are processed. The GRAS level 1b products are disseminated directly to the users and to the GRAS SAF (Meteorology Satellite Applications Facility) hosted by DMI (Danish Meteorological Institute) in Copenhagen, Denmark.

Figure 43: Overview of EPS/MetOp external and internal elements
EPS products will be made available to all users via the UMARF facility that is integrated with the EUMETSAT User Services.
|
Spacecraft |
Orbit |
Launch or projected launch |
|
NOAA-15 (K prior to launch) |
AM orbit (7:30) |
May 13, 1998 |
|
NOAA-16 (L prior to launch) |
PM orbit |
Sept. 21, 2000 |
|
NOAA-17 (M prior to launch) |
AM orbit (10:00 change!!) |
June 24, 2002 with Titan-2 vehicle |
|
NOAA-18 (N prior to launch) |
PM orbit |
May 20, 2005 with Delta-2 vehicle |
|
MetOp-A |
AM orbit |
October 19, 2006 with Soyuz vehicle |
|
NOAA-19 (N' prior to launch) |
PM orbit |
February 06, 2009 with Delta-2 vehicle |
|
MetOp-B |
AM orbit |
Sept.17, 2012 with Soyuz 2.1A/Fregat vehicle 9) |
|
MetOp-C |
AM orbit |
Planned for 2017 with Soyuz vehicle |
Table 19: Launch/projected dates of POES series and MetOp series spacecraft 84) 85) 86)
GSN (GRAS Ground Support Network):
GSN is an operational system designed and operated by ESA/ESOC to deliver supporting data to the MetOp CGS (Core Ground Segment) in order to process atmospheric sounding data delivered by the MetOp GRAS instrument and for MetOp precise orbit determination. The system is subjected to very stringent requirements in availability (99% asymptotic availability), reliability (6 hours maximal interruption, less than 3 interruptions of service per 30 days period) and accuracy (1 m for position and 1 ns for clock bias, both 2σ).
The support data consists of (Ref. //earth.esa.int/web/eoportal/satellite-missions/m/metop#1b@BD1222Herb" style="color: rgb(0, 155, 207);">83): 87)
• GPS orbit predictions and clock bias estimation. GPS orbits are updated every 3 hours, while GPS clock bias are estimated every 15 minutes and have timeliness smaller than 60 minutes (it will be updated to 45 minutes in the near future).
• Ground tracking data of all GPS occulting spacecrafts by GPS receivers globally distributed (to allow differential processing of occultations).
• Auxiliary files (i.e. Earth Orientation Parameters).
The GSN receiver station network consists of a set of approximately 40 redundant stations (25 primary and 15 back-up, which are geographically distributed (Figure 44). RINEX files of 15 minutes at 1Hz frequency are continuously provided by at least 25 stations with a latency of less than 5 minutes.

Figure 44: Overview of primary GSN stations (image credit: ESOC)
Since July 20, 2010, the GSN system is based on ESOC's NAPEOS (Navigation Package for Earth Observation Software). ESOC is one of the leading Analysis Centers of IGS (International GNSS Service). This has resulted in an increased accuracy of their GPS products.
ADA (Antarctic Data Acquisition) Project
The original EPS ground segment for MetOp missions was designed to achieve a worst case end-to-end timeliness for MetOp global products (L1) of 135 minutes. The design was based on a pipeline processing scheme where GDS (Global Data Set) data is acquired from one single ground station at Svalbard polar site. The data acquisition is performed in one single dump per orbit. The data acquisition, processing and dissemination are performed in a sequential order. 88)
A data acquisition service at the Antarctic was considered by EUMETSAT and its US partners, to improve products timeliness towards the end users. The McMurdo site was selected, and a partnership agreement between EUMETSAT and NOAA was prepared to use the McMurdo site for acquisition and delivery of MetOp GDS data to EUMETSAT HQ in Darmstadt.
ADA (Antarctica Data Acquisition) is an international partnership of EUMETSAT, NOAA, NASA and NSF (National Science Foundation) with the objective to provide a capability for EUMETSAT’s MetOp series of polar-orbiting environmental satellites. These four organizations efficiently implemented a new capability connecting McMurdo Station, Antarctica to EUMETSAT’s Darmstadt, Germany Control Centre for the purpose of improving (decreasing) the latency of MetOp satellite data by 50%, from 130 minutes to 65 minutes. The improved latency provides both European and US weather services more frequent environmental observations for near-real-time mesoscale and mid/long-range global weather forecasts. The ADA capability was achieved by integrating organizationally independent components to form a working system for high-latitude southern hemisphere data acquisition and delivery. 89)

Figure 45: Antarctic Data Acquisition nominal data flow with Agency Interfaces (image credit: ADA partnership)
Legend to Figure 45: Illustration of the multi-agency data flow from the MetOp satellite, to the NASA antenna, through the NSF local communications network and the NOAA MMCS (McMurdo Multimission Communications System) and on to the EUMETSAT Control Centre in Darmstadt, Germany.
Following a series of successful trials, EUMETSAT declared ADA operational for MetOp on schedule in June 2011 and MetOp -A became the first polar-orbiting environmental satellite to achieve the 65-minute data latency operationally (Ref. 17).

Figure 46: Overview of MetOp data dumps via Svalbard and McMurdo stations (image credit: EUMETSAT)
Figure 47 depicts the flow of MetOp data to EUMETSAT before the ADA and after the addition of the ADA. In addition to the nominal full orbit dumps of data over the northern polar station in Svalbard, the MetOp satellite now dumps additional half orbits of data over the MGS (McMurdo Ground Station) in McMurdo, Antarctica. The data dumped over McMurdo is transmitted back to Darmstadt for real-time processing, and is transferred in parallel to NOAA in Suitland via the existing communications infrastructure. Receiving the half orbits of data from McMurdo avoids having to wait an extra 50 minutes to receive the same data from Svalbard, and is the key in halving the MetOp data latency from 130 minutes to 65.

Figure 47: Before ADA and after ADA diagram of MetOp data flow (ADA partnership)
|
In the early part of the 21st Century, NOAA was pursuing a new polar-orbiting satellite constellation in cooperation with the US Department of Defense and NASA. The US system, designated the NPOESS (National Polar-orbiting Operational Environmental Satellite System), was designed to fly in each of the early-morning, mid-morning, and afternoon orbits. The NPOESS Program encountered numerous developmental challenges and as a result, in 2006 the US Government decided to not deploy a satellite into the mid-morning orbit. This decision was made primarily because EUMETSAT was already providing data for the US from that orbital location via MetOp-A under the IJPS (Initial Joint Polar System) partnership. The expectation was that data from MetOp-B and MetOp-C would continue to meet the US needs for the next 10-15 years. However, a nuance to the decision resulted in the retention of the US requirement for low data latency. To meet this latency requirement, NOAA looked to EUMETSAT to fulfill the data requirement and re-examine methods to achieve the latency requirement for the data. At the same time, EUMETSAT was investigating methods to improve the data latency of MetOp and to address a technical issue with the direct broadcast downlink on MetOp-A. After a series of meetings in mid-2006 and early 2007, NOAA and EUMETSAT agreed the most economical means to meet the both organization’s goals for improved data latency from the mid-morning orbit was to expand NOAA’s planned use of McMurdo Station, Antarctica. NOAA agreed to provide a satellite ground station capability and a Multi-Mission Communications System for acquiring MetOp Global Data Sets (GDS) and transporting them to EUMETSAT's MetOp Control Center. EUMETSAT agreed to modify the MetOp system to downlink their GDS to the NOAA-provided resources at McMurdo Station and to combine processing of the McMurdo GDS stream with their existing GDS stream from Svalbard, Norway. |
|
|
Through a series of incremental steps, NOAA and EUMETSAT expanded their partnership by first agreeing to begin work on ADA via an exchange of letters in 2007. The final terms were agreed to in 2009, and the formal agreement, known as the Supplement to the Program Implementation Plan (PIP) for the Cooperation between the NOAA and EUMETSAT on MetOp Data Downlink at McMurdo Station, Antarctica was signed in 2011. The McMurdo station, located at Hut Point Peninsula on Ross Island in McMurdo Sound (77° 55' S Latitude, 166° 39' E Longitude) , is the southern-most, largest, and most logistically capable of the national Antarctic operators collaborating in the Antarctic Treaty system that is within reach of conventional geosynchronous communications satellites. This is an ideal combination to maximize the objectives of low-latency data return held by NOAA and EUMETSAT. However, the commercial satellite industry does not consider Antarctica a market, and thus does not provide the kind of enhanced service offerings that would be needed to support the required data flow from McMurdo. While NOAA was developing its data sharing relationship with EUMETSAT, NOAA was also collaborating with NSF for the implementation of two NPOESS receptor Earth stations at McMurdo as an important component of the global NPOESS command/control/communications network. NSF is the executive agent for all US activities on the Antarctic continent, and in this role manages the United States’ Antarctic Program (USAP), a critical function the NSF has carried out since 1970. In its role as executive agent, the NSF provides logistics support, along with all infrastructure services to operate and maintain McMurdo Station. Additionally, the NSF is a key stakeholder in the NOAA-led partnership for communications services that link Antarctica to the other continents. The NSF in return provides local (on-ice) networking and microwave communications services from “downtown McMurdo” on Ross Island to the satellite uplink station the NSF operates on near-by Black Island to obtain unobstructed viewing of critical communications satellite orbit slots in the Asia-Pacific region. |
|
|
Fortunately, NOAA had partnered with both NASA and the NSF prior to ADA, and the three agencies were able to build upon previous successful collaborative efforts to enable NOAA to meet its commitment to EUMETSAT. NSF informed NOAA of a close working relationship that NSF had cultivated with the Australian satellite communications operator, Optus, while exploring the potential to re-purpose a legacy inclined-orbit Optus satellite for Antarctic communications (to the NSF Amundsen-Scott South Pole Station, located at 90°S). Optus had, at the time, a replenishment satellite for its operational fleet under construction by Orbital Sciences. NSF brokered an introduction between Optus and NOAA to explore the potential of modifying the new satellite’s service plan/antenna beam pattern to incorporate service to McMurdo. A successful match was made, resulting in the reconfiguration of the Optus D1 satellite (and its later on-orbit backup, Optus D2) to project high-gain Ku-Band service to McMurdo. This provided the missing link needed to capitalize on McMurdo’s unique southern high latitude. Although NOAA operates and maintains several CDAS (Command and Data Acquisition Stations) in the United States and at Svalbard, Norway, NOAA did not operate or maintain a CDAS at McMurdo Station at the time NOAA signed the Supplemental PIP to add ADA. In order for NOAA to provide data acquisition and data transport services per the new Supplement PIP, NOAA needed to secure the assistance from two additional US Agencies with existing assets at McMurdo Station – NASA and the NSF. |
|
|
Since the long lead times needed to deploy the necessary infrastructure at a remote location such as McMurdo precluded NOAA from independently procuring and installing a new X-band antenna system to support MetOp, NOAA asked its long-time partner, NASA, to secure use of the 10 m MGS (McMurdo Ground Station) to support MetOp X-band data acquisition. In early 2008, NOAA and NASA began negotiations on an agreement for NASA to provide NOAA the ground station services necessary to meet NOAA’s commitment to the ADA partnership. This agreement identified the major activities that NASA would undertake to meet a commitment to support the MetOp series through the launch of MetOp-C. The long-term agreement was executed in 2011. Early in 2008, NOAA reached out to its partner NSF for additional assistance. For NOAA and EUMETSAT to achieve ADA, NSF participation was essential. In order for NASA to complete the required modifications to the MGS, NASA was dependent on NSF support for cargo prioritization and on-ice civil works, including construction site preparation and heavy equipment operations. The ADA capability was achieved by integrating organizationally independent components and leveraging existing capabilities both on- and off-ice in an unprecedented display of international cooperation. |
Table 20: Some background on the ADA development history (Ref. 89)
In the end, through leveraging existing partnerships, NOAA was able to meet its requirements to utilize MetOp data in the mid-morning orbit and to reduce the latency to acquire the data. Each of the other partners also directly benefited from the ADA cooperation. EUMETSAT was able to cut delivery of its MetOp data in half; NASA was able to upgrade its MGS and have a guaranteed long-term user of MGS; and NSF was able to increase the forecast accuracy of the South Pole as well as increase the volume of data able to go in and out of McMurdo. This significant new operational capability now provides MetOop meteorological and environmental data to US and European weather services approximately twice as fast as they receive it at present by reducing the amount of time that meteorological sensor data stored on the satellite’s on-board recorders must wait before being downlinked to the ground for processing.
|
Agency |
Unique Benefits |
Common Benefits |
|
EUMETSAT |
• Strengthened IJPS partnership- with NOAA • Minimal changes to MetOp system |
• Low cost solution for improving Metop data latency from 130 mins to 65 mins on average • Access to NOAA’s MMCS (McMurdo Multi-mission Communications System) |
|
NOAA |
• Strengthened IJPS partnership- with EUMETSAT • Meets commitment via strategic partnerships with NSF and NASA • Gained cost-sharing partner for MMCS |
• Low cost solution for improving MetOp data latency from 130 to 65 minutes on average |
|
NSF |
• International recognition for McMurdo Station’s role for high latitude space data acquisition as a conjugate to Svalbard in the Northern Hemisphere • Leveraging the NSF mission in Antarctica with NOAA and NASA missions to provide greater return on the U.S. national investment • Low overhead/simplified management for NSF (only 1 bilateral agreement needed – NSF-NASA for MGS hosting and logistical support • Infrastructure upgrades at McMurdo (MGS road access, local area network improvements, etc.) |
• Improved forecasting and weather predictions for flight and search/rescue operations in Antarctica as a result of improved latency and local access to data • Affordable communications enhancements for NSF’s science program via access to the MMCS (McMurdo Multi-mission Communications System) |
|
NASA |
• Gained long-term customer for MGS • Refurbished aging antenna system and upgraded ground station electronics for MGS with remote operability and increased capability to support future NASA missions • Cost-sharing partner for MGS, upgrades, operations and maintenance • Infrastructure upgrades at McMurdo (MGS road access, local area network improvements, etc.) |
• Affordable communications enhancements for NASA’s space data ground network via access to the MMCS |
Table 21: Agency benefits of ADA (Ref. 89)

Figure 48: Interagency cooperation and participation (image credit: ADA partnership)
1) C. Cohen, P. G. Edwards, “EPS, the European contribution to the NOAA/EUMETSAT Initial Joint Polar system (IJPS),” Proceedings of IAC 2004, Vancouver, Canada, Oct. 4-8, 2004, IAC-04-B.1.02
2) P. G. Edwards, D. Pawlak, “MetOp: The Space Segment for EUMETSAT's Polar System,” ESA Bulletin, No 102, May 2000, pp. 7-18, URL: undefined
3) P. G. Edwards, B. Berruti, P. Blythe, J. Callies, S. Carlier, C. Fransen, R. Krutsch, A.-R. Lefebvre, M. Loiselet, N. Stricker, “The MetOp Satellite - Weather Information from Polar Orbit,” ESA Bulletin, No 127, Aug. 2006, pp. 8-17, URL: undefined
4) M. Cohen, G. Mason, Y. Buhler, D. Provost, D. Klaes, X. Calbet, “The EUMETSAT Polar System - A Major Step for Operational Meteorology,” ESA Bulletin, No 127, Aug. 2006, pp. 18-23, URL: undefined
5) François Spoto, Yves Bordes, Simon Chalkley, Luis Huertas, Omar Sy, Yves Buhler , Jean-Michel Caujolle, “Preparing MetOp for Work - Launch, Early Operations and Commissioning ,” ESA Bulletin, No 127, Aug. 2006, pp. 24-30, URL: undefined
7) MetOp - Monitoring the Weather from Polar Orbit,” ESA brochure BR-261, May 2006, URL: undefined
8) D. Pawlak, C. Bousquet, “MetOp: the space segment of the EUMETSAT Polar System,” Proceedings of the 2000 EUMETSAT Satellite Data Users' Conference, Bologna, Italy, May 29-June 2, 2000, pp. 209-213
9) “Europe’s second polar-orbiting weather satellite is aloft,” ESA, Sept. 17, 2012, URL: undefined
10) “Metop-B takes over prime operational service,” EUMETSAT, April 24, 2013, URL: undefined
11) “Is the ozone layer on the road to recovery?” ESA, Feb. 8, 2013, URL: undefined
12) “The IASI instrument on MetOp-B produces first data,” EUMETSAT Press Release, Oct. 30, 2012, URL: undefined
13) “Metop-B delivers first data from polar orbit,” ESA, Sept. 28, 2012, URL: undefined
14) “ESA hands over control of the MetOp-B weather satellite to EUMETSAT,” EUMETSAT Press Releases, Sept. 21, 2012, URL: undefined
15) Tim Hewison, Marianne Koenig, Sebastien Wagner, Rob Roebeling, Peter Miu, Jörg Schulz, Harald Rothfuss, “EUMETSAT GPRC Report,” May 30, 2012, URL: undefined
16) “Fifth anniversary of Metop-A in orbit,” EUMETSAT, October 19, 2011, URL: undefined
17) “Faster MetOp-A Data Delivery from 10 June, 2011,” EUMETSAT, June 9, 2011, URL: undefined
18) “MetOp-A,” ESA Bulletin No 146, May 2011, p. 97
19) “MetOp status,” ESA Bulletin, No 145, February 2011, p. 84
20) “MetOp-A monitors marine life,” Jan. 13, 2011, URL: undefined
21) Weather Satellite Status Report, Jan. 2011, URL: undefined
22) “Extended Geographical Coverage for Metop-A Direct Readout Service,” EUMETSAT, Jan. 13, 2011, URL: undefined
23) ESA Bulletin Nr. 141, Feb. 2010, p. 72
24) “Metop-A Completes 20,000th Orbit,” Science Daily, Aug. 27, 2010, URL: undefined
25) Laurence Buffet, Carole Larigauderie, Dominique Montero, Flavio Murolo, Stephan Anstötz, Patrick Astruc, Odile Andreis, Alain Pacifico, “MetOp/IASI revisited operations concept : several ways to minimize mission down time w.r.t. SEUs,” Proceedings of the SpaceOps 2010 Conference, Huntsville, ALA, USA, April 25-30, 2010, paper: AIAA 2010-2191
26) Hans Bonekamp, Craig Anderson, Julia Figa, Julian Wilson, “ASCAT Mission Overview,” EUMETSAT/ESA Scatterometer Science Conference, Darmstadt, Germany, April 11-13, 2011
27) J.-P. Gardelle, “MetOp-A in-orbit commissioning,” 58th IAC (International Astronautical Congress), International Space Expo, Hyderabad, India, Sept. 24-28, 2007, IAC-07-B1.I.18
28) Janet C. Green, Andrew Monham, Allan Tylka, Conrad Jackson, Gretchen Lindsey, “Defining radiation ‘safe’ zones for operating the High Rate Picture Transmission (HRPT) instrument onboard the METOP satellite,” Proceedings of the SpaceOps 2010 Conference, Huntsville, ALA, USA, April 25-30, 2010, paper: AIAA 2010-2136
29) Lionel de la Taille, Andrew Monham, Anders Soerensen, Jose M de Juana, Antimo Damiano, “Risk vs Return: Mitigating an on-board radiation failure susceptibility,” Proceedings of the SpaceOps 2010 Conference, Huntsville, ALA, USA, April 25-30, 2010, paper: AIAA 2010-1930
30) “Successful completion of Metop-A Satellite In-Orbit Verification (SIOV) phase,” March 30, 2007, URL: undefined
32) J. Figa-Saldana, J. J. W. Wilson, E. Attema, R. Gelsthorpe, M. R. Drinkwater, A. Stoffelen, “The advanced scatterometer (ASCAT) on the meteorological operational (MetOp) platform: A follow on for European wind scatterometers,” Canadian Journal of Remote Sensing, Vol. 28, No. 3, pp. 404-412, June 2002
33) R. V. Gelsthorpe, E. Schied, J. J. W. Wilson, “ASCAT - MetOp's Advanced Scatterometer,” ESA Bulletin, No 102, May 2000, pp. 19-27, URL: undefined
34) “ASCAT Advanced Scatterometer,” ESA brochure
35) F. Rostan, M. Kuntz, S. Schütz, “The Advanced Scatterometer (ASCAT) Ground Processing Prototype,” Proceedings of IGARSS'99, Vol. I, Hamburg, June 28 - July 2, 1999, pp. 224-226
36) H. Ebner, H. R. Schulte, H. Hölzl, D. Miller, P. Hans, “ASCAT - Advanced Wind Scatterometer,” IGARSS`92, Volume I, pp. 435-439
37) Abelardo Pérez Albinana, Julian Wilson, Gokhan Kayal, Graeme Mason, “The Payload for the Polar Orbiting Operational Meteorological Satellite Metop,” SPIE Conference Optics & Photonics 2005, Vol. 5883, San Diego, CA, July 31 - Aug. 4, 2005
38) F. Rostan, M. Kuntz, S. Schütz, “The Advanced Scatterometer (ASCAT) Ground Processing Prototype,” IGARSS'99 Proceedings, Hamburg, June 28-July 2, 1999, Vol. 1, pp. 224-226
39) A. Stoffelen, “Error Modeling and Calibration; towards the true surface wind speed,” Journal of Geophysical Research, Vol. 103, 1998, pp. 7755-7766
40) F. Rostan, “The Calibration of the MetOp/Advanced Scatterometer (ASCAT),” IEEE/IGARSS 2000, Honolulu, HI, July 24-28, 2000
41) C. J. Bushell, et al., “Humidity Sounders for the 21st Century,” Proceedings of the EUMETSAT Meteorological Satellite User's Conference, Copenhagen, Denmark, Sept. 6-10, 1999, pp.77-84
42) G. Shaw, C. J. Bushell, “The Radiometric Performance of the Microwave Humidity Sounder,” Proceedings of the EUMETSAT Meteorological Satellite User's Conference, Copenhagen, Denmark, Sept. 6-10, 1999, pp.135-139
44) “IASI - an infrared sounder for operational meteorology,” CNES Magazine, No 19, May 2003, p. 10
45) Ph. Hébert, D. Blumstein, C. Buil, T. Carlier, G. Chalon, P. Astruc, A. Clauss, D. Siméoni,B. Tournier, “IASI Instrument: Technical Description and Measured Performances,” Proceedings of the 5th International Conference on Space Optics, March 30-April 2, 2004, Toulouse, France, ESA SP-554
46) T. Carlier, B. Millet, D. Blumstein, G. Ponce, F. Bernard, G. Chalon, “In-orbit characterization of the infrared atmospheric sounding interferometer (IASI) on MetOp-A,” 58th IAC (International Astronautical Congress), International Space Expo, Hyderabad, India, Sept. 24-28, 2007, IAC-07-B1.3.03
47) Laurence Buffet, Eric Pequinot, Denis Blumstein, Roger Fjortoft, Vincent Lonjou, Bruno Millet, Carole Larigauderie, “IASI Instrument Onboard MetOp-A: Lessons Learned after almost two Years in Orbit,” Proceedings of the 7th ICSO (International Conference on Space Optics) 2008, Toulouse, France, Oct. 14-17, 2008
48) D. Simeoni, C. Singer, G. Chalon, “Infrared Atmospheric Sounding Interferometer,” IAF-96-B3.P212, Acta Astronautica, Vol. 40, No. 2-8, pp. 113-118, 1997
49) “Improved Atmospheric Sounding Infrared,” ASI/CNES brochure, April 1991
51) Th. Phulpin, et al., “IASI on METOP: project status of the instruments and system,” 12th ASSFTS (Atmospheric Science from Space using Fourier Transform Spectrometry) Workshop, May 18-20, 2005, Quebec City, Canada, URL:undefined
54) Gilles Chalon, Francois Cayla, Dorothée Diebel, “IASI : An Advance Sounder for Operational Meteorology,” URL: undefined
55) M.-C. Arnolfo, “Uncooled Microbolometer Camera for Spaceborne IR Observation - Qualification Results,” Proceedings of IAC 2004, Vancouver, Canada, Oct. 4-8, 2004, IAC-04-B.3.07
56) Vincent Lonjou, Laurence Buffet, Jordi Chinaud, Carole Larigauderie, Frédérique Meunier, Eric Péquignot, “The IASI technical expertise center : IASI tuning and performance monitoring,” Proceedings of the SpaceOps 2010 Conference, Huntsville, ALA, USA, April 25-30, 2010, paper: AIAA 2010-2310
57) Fiona Hilton, Raymond Armante, Thomas August, Chris Barnet, Aurelie Bouchard, Claude Camy-Peyret, Virginie Capelle, Lieven Clarisse, Cathy Clerbaux, Pierre-Francois Coheur, Andrew Collard, Cyril Crevoisier, Gaelle Dufour, David Edwards, Francois Faijan, Nadia Fourrié, Antoni a Gambacorta, Mitch ell Goldberg, Vincent Guidard, Daniel Hurtmans, Samuel Illingworth, Nicole Jacquinet-Husson, Tobi as Kerzenmacher, Dieter Klaes, Lydie Lavanant, Guido Masiello, Marc o Matricardi, Anthony McNally, Stuart Newman, Edward Pavelin, Sebastien Payan, Eric Péquignot, Sophi e Peyridieu, Thierry Phulpin, John Remedios, Peter Schlüssel, Carmine Serio, Larrabee Strow, Claudia Stubenrauch , Jonathan Taylor, David Tobin, Walter Wolf, Daniel Zhou, “Hyperspectral Earth Observation from IASI: Five Years of Accomplishments,” BAMS (Bulletin of the American Meteorological Society), Vol. 93, Issue 3, March 2012, pp. 347-370, URL: undefined; the paper is also available at URL: undefined
58) J. Callies, E. Corpaccioli, M. Eisinger, A. Hahne, A. Lefebvre, “GOME-2 - MetOp's Second-Generation Sensor for Operational Ozone Monitoring,” ESA Bulletin, No 102, May 2000, pp. 28-36, URL: undefined
59) J. Callies, E. Corpaccioli, M. Eisinger, A. Lefebvre, R. Munro, A. Perez-Albinana, “The New Advanced Polarization Measurements of GOME-2 on-board the MetOp satellites,” Proceedings of SPIE, Vol 4814, SPIE Annual Meeting 2002: Remote Sensing and Space Technology, July 7-11, 2002, Seattle, WA
61) W. G. Melbourne, et al., “The application of spaceborne GPS to limb sounding and global monitoring,” JPL publication 94-18, 1994
62) J.-P. Luntama, “EPS GRAS mission for operational GPS Meteorology,” ION GPS 2001, Sept. 11-14, 2001, Salt Lake City, UT
63) M. Loiselet, N. Stricker, Y. Menard, J.-P. Luntama, “GRAS - MetOp's GPS-based Atmospheric Sounder,” ESA Bulletin, No 102, May 2000, pp. 38-44, URL: undefined
64) M. Loiselet, N. Stricker, Y. Menard, J.-P. Luntama, “GNSS Radio Occultation Receiver for Atmospheric Sounding,” Proceedings of the 2000 EUMETSAT Meteorological Satellite Data Users' Conference, Bologna, Italy, May 29, June 2, 2000, pp. 192-200
65) G. Bergeton Larsen, “Atmospheric Products from the GRAS Meteorology SAF (Satellite Application Facility),” Proceedings of the 2000 EUMETSAT Meteorological Satellite Data Users' Conference, Bologna, Italy, May 29, June 2, 2000, pp. 243-249
66) W. Zsalcsik, F. Zangerl, W. Brunda, “Radio Occultation GPS Receiver Validation and Verification,” NAVITEC 2001, 1st ESA Workshop on Satellite Navigation User Equipment Technologies, Dec. 10-12, 2001, ESA/ESTEC
69) M Bonnedal, A Berg, J Christensen, “MetOp GRAS Open Loop Tracking Performance,” Proceedings of NAVITEC 2008, 4th ESA Workshop on Satellite Navigation User Equipment Technologies GNSS User Technologies in the Sensor Fusion Era, Dec. 10-12, 2008, Noordwijk, The Netherlands
70) M. Loiselet, N. Stricker , Y. Menard, J.-P. Luntama, “GRAS – Metop’s GPS-Based Atmospheric Sounder,” ESA Bulletin, No 102, May 2000, pp.38-44, URL: undefined
71) M. Hassel, “Dual Frequency Patch Antenna for GPS Occultation Measurements,” Proceedings of the 25th ESA Antenna Workshop on Satellite Antenna Technology, ESTEC, Noordwijk, The Netherlands, Sept. 18-20, 2002, pp. 537-542
72) Marc Loiselet, Nico Stricker, Jacob Christensen, Carmelo Carrascosa, “In-orbit verification results from GRAS receiver on MetOp-A satellite,” 2007, URL: undefined
73) P. Sinander, “AGGA-2 Data Sheet, Advanced GPS/GLONASS ASIC for Space Applications,” ESTEC, TOSESM/PS/100, Issue 1, Dec. 2, 1999.
74) M. Loiselet, N. Stricker, J. Christensen, C. Carrascosa, “In Orbit Verification Results from GRAS Receiver on MetOp-A Satellite, Proceedings of the Joint 2007 EUMETSAT Meteorological Satellite Conference and the 15th Satellite Meteorology & Oceanography Conference of the American Meteorological Society, Amsterdam, The Netherlands, Sept. 24-28, 2007
75) Magnus Bonnedal, Thomas Lindgren, Anders Carlström, Jacob Christensen, “MetOp GRAS: Signal Tracking Performance Results,” Proceedings of NAVITEC 2010 (5th ESA Workshop on Satellite Navigation Technologies and Europen Workshop on GNSS Signals and Signal Processing), Noordwijk, The Netherlands, Dec. 8-10, 2010
76) K. B. Lauritsen, H. Gleisner, M. E. Gorbunov, F. Rubek, M. B. Sorensen, “The GRAS Project: Radio Occultation Product from MetOp,” Proceedings of the Joint 2007 EUMETSAT Meteorological Satellite Conference and the 15th Satellite Meteorology & Oceanography Conference of the American Meteorological Society, Amsterdam, The Netherlands, Sept. 24-28, 2007
77) F. Rubek, G. Bergeton Larsen, J. M. Aparicio, “The GRAS SAF Project - an Operational Radio Occultation System,” ION GPS 2001, Sept. 11-14, 2001, Salt Lake City, UT
78) Advanced Data Collection System Instrument Control Document, EUMETSAT, EADS-Astrium, April 2005, URL: undefined
79) “The Argos-3 (or A-DCS) instruments,” 40th Argos Operations Committee meeting, CNES, May 24, 2005
80) “Description of the Payloads Used in the COSPAS-SARSAT LEOSAR System;” C/S T.003, Issue 3, Rev. 4, Nov. 2007, COSPAS-SARSAT
82) D. S. Evans, M. S. Greer, “Polar Orbiting Environmental Satellite, Space Environment Monitor-2, Instrument Descriptions and Archive Data Documentation,” NOAA Technical Memorandum, Jan. 2004, version 1.4, URL: undefined
83) Y. Andrés, P.L. Righetti, C. Marquardt, “Near Real-Time Precise Orbit Determination for Radio Occultation and Altimetry Missions,” Proceedings of ION GNSS 2010, Portland, OR, USA, Sept. 21-24, 2010
84) “New launch date confirmed for Metop-B,” ESA, June 28, 2012, URL: undefined
85) Jose M de Juana, Dorothee Diebel, Pier Luigi Righetti, Wael El-Dali, “MetOp-B launch and phasing strategy in the presence of MetOp-A,” Proceedings of the SpaceOps 2010 Conference, Huntsville, ALA, USA, April 25-30, 2010, paper: AIAA 2010-2021
86) Stephen Clark, “Europe's next MetOp satellite arrives at launch base,” Spaceflight Now, March 6, 2012, URL: undefined
87) R. Zandbergen, the GRAS GSN team (ESOC, EUMETSAT), “Ground Support Network operations for the GRAS Radio Occultation Mission,” OPAC (Occultations for Probing Atmosphere and Climate). 2010 International Workshop, Graz, Austria, Sept. 6-11, 2010, URL: undefined
88) “ADA - EPS OGS Delta Requirements,” EUMETSAT, Sept. 22, 2010, URL: undefined
89) James M. Valenti, Andrew Monham, Conor Keegan, William G. Munley, Jr., Patrick D. Smith, Kevin P. McCarthy, “MetOp’s Antarctic Data Acquisition Project An International Partnership Success,” Proceedings of SpaceOps 2012, The 12th International Conference on Space Operations, Stockholm, Sweden, June 11-15, 2012, URL: undefined
The information compiled and edited in this article was provided by Herbert J. Kramer from his documentation of: ”Observation of the Earth and Its Environment: Survey of Missions and Sensors” (Springer Verlag) as well as many other sources after the publication of the 4th edition in 2002. - Comments and corrections to this article are always welcome for further updates.


